")
[ad_1]

Eloi_Omella/E+ via Getty Images
Investment Thesis
The Utilities Select Sector SPDR ETF (NYSEARCA:XLU) is the largest Utility ETF on the market today, with $13.45 billion in assets under management and a minimal 0.10% expense ratio. Although XLU has outperformed the SPDR S&P 500 ETF (SPY) by about 10% YTD, it’s been a laggard since the Great Financial Crisis ended, and one might question why to bother with these high-yield securities in the face of increased competition from rising interest rates. Unfortunately, it’s not that simple, and today, I will argue why the recent flattening of the yield curve should get you thinking about boosting your Utility sector exposure soon. In addition to giving an overview of the factors that can affect utility stocks, I will assess the fundamentals of XLU alongside eight other Utility ETFs so you know where the best value lies. My bullish rating today isn’t because of XLU’s 3.06% dividend yield but because it’s the most efficient way to lower your portfolio’s risk in the face of what could be a severe market downturn ahead. Like buying insurance, it’s better to be safe than sorry.
Overview
XLU tracks the Utilities Select Sector Index, representing S&P 500 utility stocks. Effective January 31, 2022, XLU’s expense ratio decreased from 0.12% to 0.10%, making it tied for the second-cheapest Utilities ETF alongside the Vanguard Utilities ETF (VPU) and behind the Fidelity MSCI Utilities Index ETF (FUTY), which charges 0.08%. Most exposure is with Electric Utilities (61.46%) and Multi-Utilities (31.01%), though four stocks are independent power producers, water utilities, or gas utilities. State Street lists the top ten holdings below, which total 62.69%.
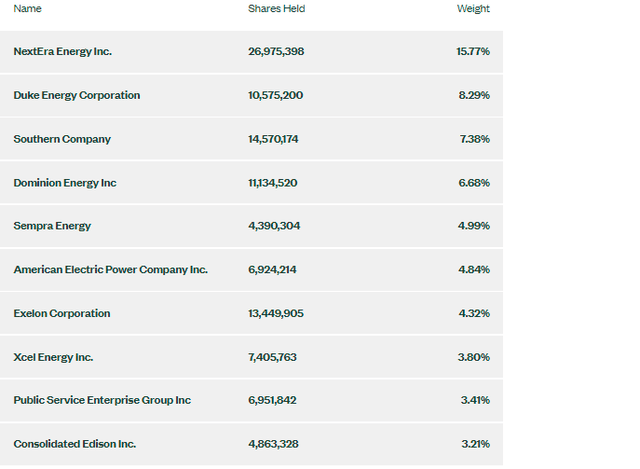
State Street Global Advisors
The largest holding is NextEra Energy (NEE), which has seen its P/E contract this year along with most other richly-valued stocks on the major indices. I covered NextEra Energy in December 2020 when its forward P/E was 41.04. Now it’s 28.29, and NextEra has trailed XLU by almost 7% since. As you’ll see in this article, my approach to investing is fundamentally-based. I also prefer using actual earnings data to gauge changes in sentiment rather than relying on technical indicators, many of which I find confusing and unreliable. Before continuing, I’d like to use this space to insert some key ETF metrics you can reference later.
- Current Price: $71.25
- Assets Under Management: $13.71 billion
- Shares Outstanding: 192.62 million
- Expense Ratio: 0.10%
- Launch Date: December 16, 1998
- Forward Dividend Yield: 3.06%
- Five-Year Dividend CAGR: 3.82%
- Ten-Year Dividend CAGR: 3.89%
- Five-Year Beta: 0.45
- Number of Securities: 29
- Portfolio Turnover: 3%
- Assets in Top Ten: 62.69%
- 30-Day Median Bid-Ask Spread: 0.01%
- Tracked Index: Utilities Select Sector Index
Note that the forward dividend yield of 3.06% is only about one percent more than the ten-year U.S. Treasury yield, and the 4% dividend growth rate is meager compared to most other dividend-paying securities. These are all valid points, but today’s play is for protection, not income. Dividend ETFs, which I review monthly, are better suited for income investors.
Problems With The Cost of Service Model
Many North American utilities operate on a cost of service model, where a formula determines how much money a utility can make. The first step is determining the rate base, which is the historical cost of all assets used to provide service to customers after subtracting accumulated depreciation. Through Public Utility Commissions, regulators determine an allowable return on equity (usually between 8-10%), and expenses are added to calculate the total revenue requirement. This revenue requirement is used to determine rates, and the predictability allows utilities to pay large percentages of their earnings as dividends. Payout ratios for XLU’s 29 constituents, for example, average 64%, and XLU’s components have grown dividends at an annualized 6.64% rate over the last five years.
However, there are apparent problems with this model. For example, since expenses are passed on to customers, there’s little incentive to be efficient. In addition, the model incentivizes unnecessary investments not always in the public’s best interest. Such projects increase the rate base, which, in turn, increases earnings. As a solution, many jurisdictions are moving to Performance-Based Regulation [PBR], as described below:
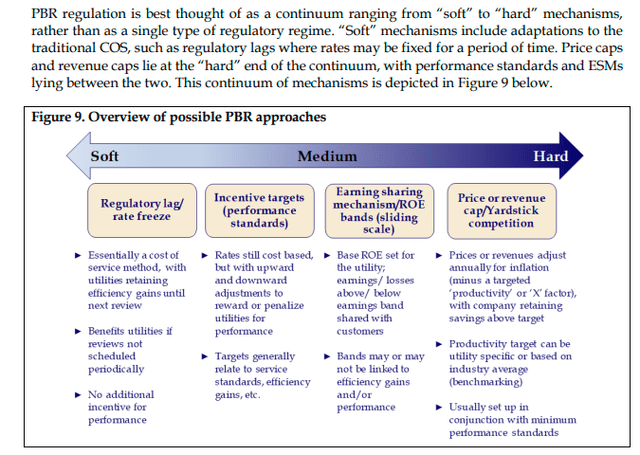
Commission of Inquiry Respecting The Muskrat Falls Project, Exhibit P-04457
According to this article, PBR has been used or considered in 19 states and the District of Columbia since 2015. However, it’s a slow-moving process, and it’s going to be difficult to achieve social and economic goals quickly (e.g., decarbonization, modernizing grids, etc.) without neatly aligning the utilities’ incentives with the needs of the public.
Historical Performance
Since Inception
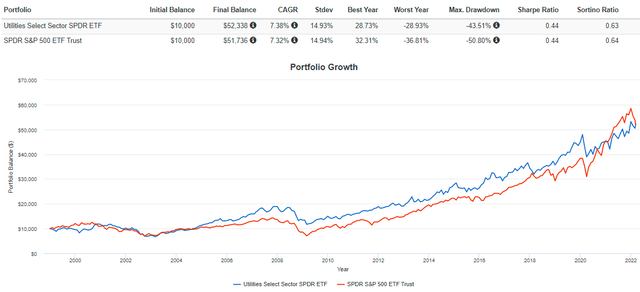
To adequately assess performance, it’s essential to look at various periods because different conclusions are drawn depending on what chart you’re viewing. For example, XLU has matched SPY’s performance since its inception, gaining an annualized 7.38% with near-identical volatility. It certainly seems prudent to include utilities in your portfolio in the long run.
Portfolio Visualizer
Drawdowns
During the Great Financial Crisis, XLU was one of the better sector ETFs to own. Its 37.64% drop between November 2007 and February 2009 was substantial, but still 13% better than SPY. Only the Consumer Staples Select Sector SPDR ETF (XLP) did better, falling 26.15%. I’ve listed the S&P 500’s top ten drawdowns since January 1999 below. XLU had an 8% lower drawdown on average, and in 2012 and 2018, it even managed to produce a small gain.
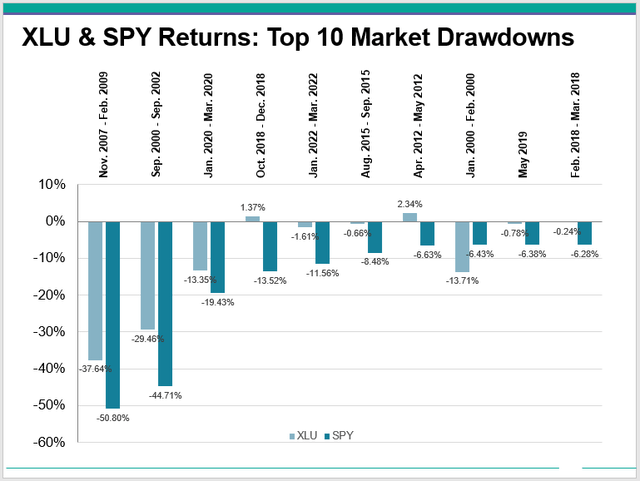
Author
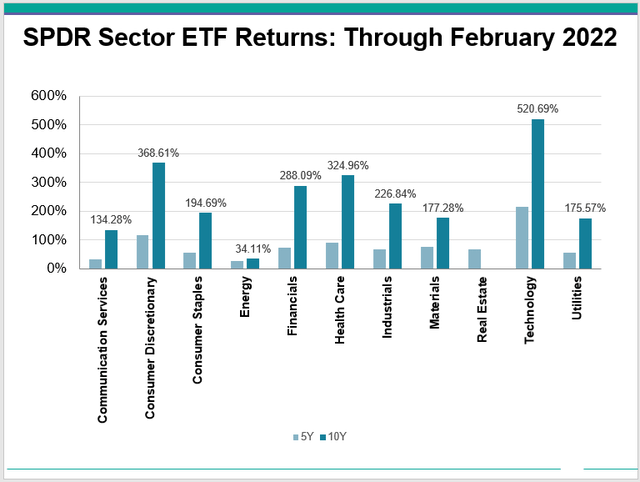
Five and Ten Year Sector Returns
In the last ten years through February 2022, Utilities gained a respectable 175.57% (10.67% annualized), though that’s only better than Communication Services (134.28%) and Energy (34.11%). The same has been mostly true for the last five years. Keep in mind that these are periods of declining rates, so cheap financing hasn’t necessarily benefited the sector much. As I’ll demonstrate later, the same is true for periods of rising rates, and the relationship is a weak one at best.
Author
Factors Influencing Utility Stocks
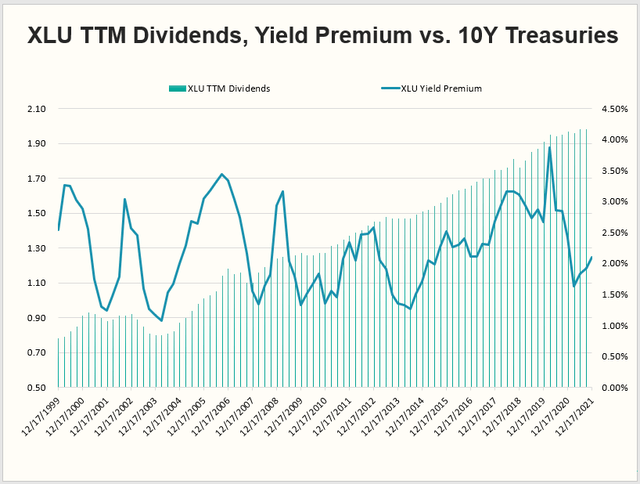
Many investors buy utilities for dividends, and some even use them as bond proxies. However, XLU’s current yield isn’t desirable considering its relationship to the ten-year treasury yield. The graph below plots XLU’s trailing twelve-month dividends and its yield premium over treasuries since December 1999. On XLU’s most recent ex-dividend date on December 17, 2021, its 2.88% dividend yield was 2.10% higher than the 0.78% treasury yield. However, treasury yields have since climbed to 2.13%, leaving a yield premium of only 0.71% as of March 14, 2022. The last time the premium was even near this level was on March 19, 2004, when XLU’s 3.31% yield was 1.07% higher than the ten-year treasury. The long-term average premium was 2.24%, so XLU doesn’t make sense as a dividend play now given the alternatives.
Author
We can also look at the relationship between XLU’s excess return over SPY and the yield premium. Many expect the two are correlated, but the data isn’t convincing.
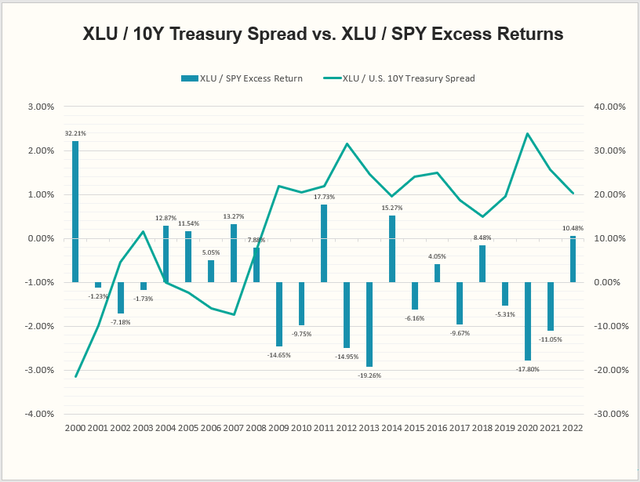
Author
The column bars represent how XLU performed compared with SPY each year, while the line corresponds with how much larger XLU’s average annual dividend yield was compared to the ten-year treasury yield. From 2000-2008, when XLU’s dividend yield was almost always less than the ten-year treasury yield, XLU outperformed SPY by significant margins in several years: 32.21% in 2000, 12.87% in 2004, 11.54% in 2005, and 13.27% in 2007. Results were mixed from 2009-2022 when XLU’s dividend yield was always more than the ten-year treasury yield. XLU beat SPY by 17.73% in 2011, 15.27% in 2014, and 10.48% YTD in 2022, but also substantially underperformed in 2009, 2012, 2013, 2020, and 2021.
The takeaway here is that analyzing the strength of the utilities sector is more complicated than looking at the 10-year treasury yield. For example, Public Utility Commissions are more likely to grant higher allowable ROEs as interest rates rise, reversing a trend since 2013.
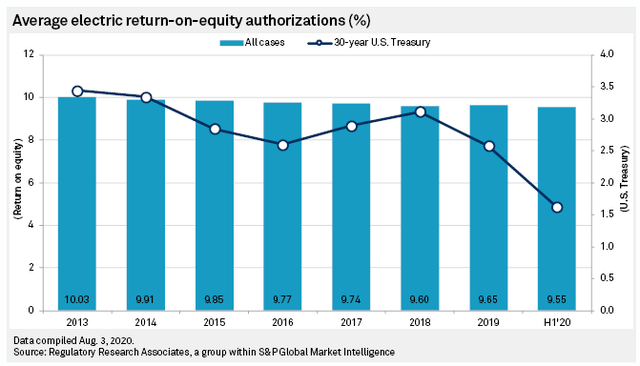
S&P Global Research
Sentiment is a crucial factor in how defensive sectors perform. The graph below summarizes S&P 500 quarterly revenue and earnings surprises since Q1 2009. While the long-term EPS surprise is between 5% and 6%, there were significant surprises in 2009-2010 and 2020-2021. This risk-on sentiment was not favorable to defensive stocks in those years, and XLU underperformed accordingly. However, the trend is now negative, so utility stocks may be poised for a solid year.
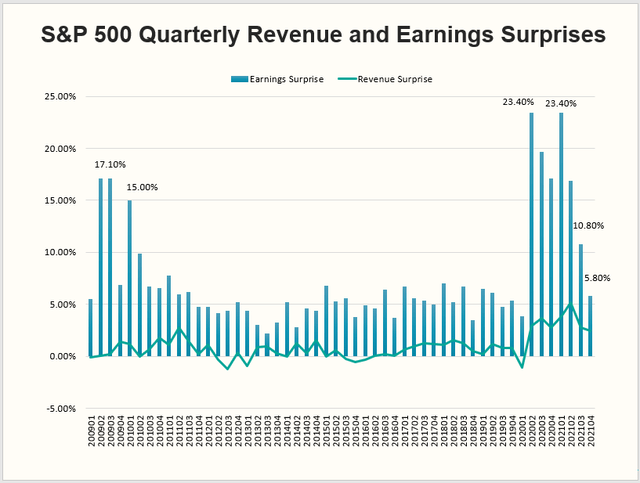
Author Using Data From Yardeni Research
Also, the recent flattening of the yield curve suggests safe haven stocks are more attractive than usual. A glance at the yield curve indicates that as the curve inverts, what usually follows is long-term rates increasing at a faster pace and a recession occurs (shaded areas). In my view, the Fed has backed itself into a tight spot right now. Rates need to rise to fight inflation, but inflation is mainly supply-chain-driven. Raising rates might have little impact and could potentially make a bad problem even worse.
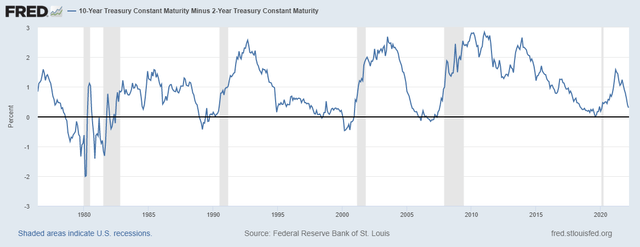
Federal Reserve Bank of St. Louis
Fundamental Analysis
To further illustrate what XLU offers, I’ve prepared this fundamental analysis comparison with SPY. The table below highlights risk, dividend, growth, and valuation metrics for XLU’s top 20 holdings, which total 87.48%. These weights are adjusted to exclude XLU’s small percentage of cash holdings.
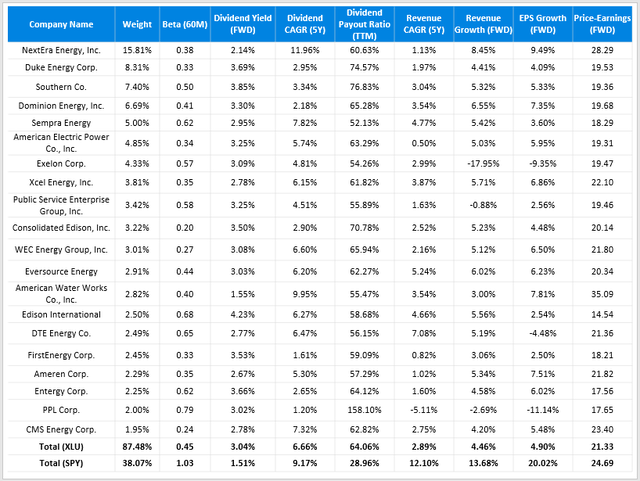
Author Using Data From Seeking Alpha
As shown, nearly all utilities are low growth stocks. The weighted-average revenue and earnings per share growth rates are only 4.46% and 4.90% compared to 13.68% and 20.02% for SPY. The forward price-earnings discount isn’t much either (21.33 vs. 24.69), so it’s unlikely to win the backing of growth-at-a-reasonable-price investors. For example, Invesco S&P 500 GARP ETF (SPGP) has no exposure to utilities. However, the standout is XLU’s 0.45 five-year beta. Income investors can turn to dividend ETFs for better yield and dividend growth, but for the most part, betas will be between 0.85 and 0.95.
Finally, I’ve identified eight other Utilities-focused ETFs in my U.S. Equity ETF Database. I’ve calculated summary fundamental metrics for them all and sorted them by five-year total returns through February 2022. XLU performed the best out of the low-fee options with a total return of 54.50%.
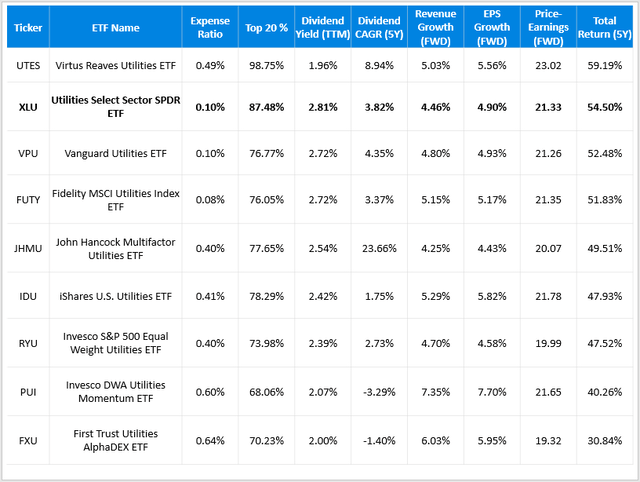
Author
A few are trading at lower price-earnings ratios, such as the Invesco S&P 500 Equal Weight Utilities ETF (RYU) and the First Trust Utilities AlphaDex ETF (FXU). Still, their expense ratios are just too high. The Invesco DWA Utilities Momentum ETF (PUI) looks to have a better combination of growth and value, but that’s because its top holding is ONEOK (OKE), an Oil & Gas Storage & Transportation stock. As such, its five-year beta is much higher (0.57), so it’s not going to give you the same degree of risk reduction. After assessing the fundamentals of all these alternatives, I think investors are best sticking with the low fee ETFs like XLU, VPU, and FUTY.
Investment Recommendation
The market is flashing enough warning signs to warrant investors lowering their portfolio’s risk, and XLU is the most effective equity option available. Earnings surprises have decreased for three consecutive quarters, the yield curve is close to inverting, and Public Utility Commissions are likely to allow higher ROEs as rates rise. The utilities sector only has 2.78% exposure in the S&P 500, and a low-cost, low-risk ETF like XLU is an easy way to boost your exposure depending on your risk tolerance and time horizon.
XLU, or any Utility ETF for that matter, should not be bought for its dividend right now. It yields only 3%, about one percent more than the yield on ten-year treasuries. Instead, I view it like buying insurance. I wish the P/E ratio were lower, and I’m slightly uncomfortable with NextEra Energy having such a high weighting, but that’s just what’s on offer today. You could opt for a less concentrated, lower P/E fund like RYU, but the higher expense ratio might negate any benefits. In summary, I’m confident XLU is one of the better utility ETFs available and am rating it as a buy to effectively protect your assets in the next downturn.
[ad_2]
Source links Google News