
[ad_1]

Darren415
As 2023 is approaching, the major question investors are likely asking themselves at this point is what factors are now offering the best risk/reward profile. At first blush, the growth style (defined broadly) is the best niche to tilt portfolios to since the magnitude of the decline of stocks most exposed to the growth factor, especially those without a layer of safety that could be added by high quality, has been simply enormous this year.
Today, I would like to take a closer look at the iShares Morningstar Mid-Cap Growth ETF (NYSEARCA:IMCG), a fund bringing together the mid-size and growth factors. IMCG has a few advantages, like its paper-thin expense ratio of 6 bps; however, I am arguing against cranking up bets on it or similar growth-oriented funds prematurely.
In the article, I would like to illustrate why IMCG’s focus on mid-caps is misleading, what growth rates pundits are expecting its holdings to deliver in the near future, what price investors should expect to pay for these rates, whether the quality is adequate, and whether all of the above may be considered as an adequate background for a bullish thesis.
Investment strategy. Looking at growth and value in the mix
IMCG has a fundamentals-driven strategy, with the Morningstar US Mid Cap Broad Growth Index lying at its crux. It has a highly sophisticated methodology which is described in the respective documents. In short, the index is supposed to reflect the performance of stocks sporting comparatively higher-than-average delivered and forecasted net earnings, sales, book value, and cash flow growth. The index follows a biannual reconstitution and quarterly rebalancing schedules.
Please bear in mind that though the fund was incepted on 28 June 2004, before 19 March 2021 it had a ticker JKH and its underlying index was the Morningstar US Mid Growth Index, so in the performance section, we will be looking into the returns data for the April 2021 – November 2022 and YTD periods.
The IMCG portfolio has a solid depth of exposure, with 336 holdings and the major 10 stocks accounting for an adequate 10.3% in the current version. Amongst the key sectors are information technology (22.1%), industrials (18.9%), and healthcare (15.2%). This is in contrast with the iShares Russell 2000 Growth ETF (IWO) which has meaningfully larger exposure to healthcare (mostly biotechs, which I discussed in the article last year), energy, and consumer staples. Both funds have lower allocations to IT, communication, and financials than the iShares Core S&P 500 ETF (IVV).
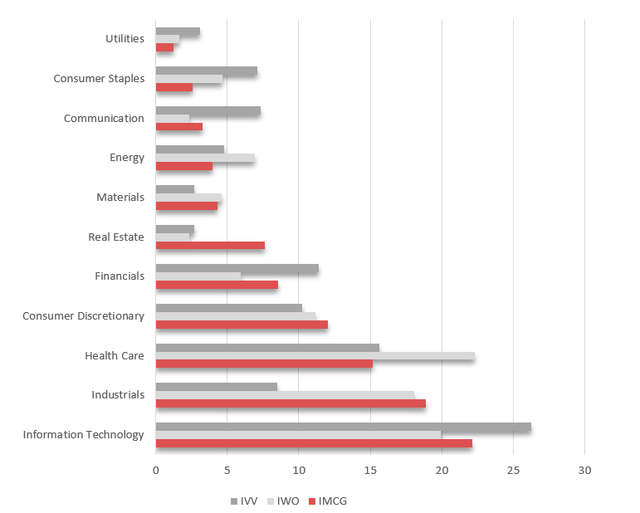
Created by the author using data from the funds
The essential remark worth making at this point is that investors seeking exposure to a portfolio of mid-size companies sporting above-average growth rates would likely be disappointed by the fact that IMCG is in reality underweight mid-caps.
The truth is, as per my calculations, the weighted-average market capitalization stands at about $22.5 billion, reflecting the fact that over 88% of the holdings have a market value north of $10 billion. The median is $14.2 billion, which supports the point that mid-cap-focused investors should think twice before buying into IMCG. In that case, they should take a closer look at the above-mentioned IWO, for example, which has a weighted-average market cap of its 1,109-strong portfolio at just $2.8 billion.
IMCG’s essential holding with a 1.2% weight is Agilent Technologies (A), a life sciences tools & services industry player serving pharma & biotech, chemical & energy, food, and other end-markets and boasting an over $45 billion market capitalization. Agilent is forecast to deliver solid EBITDA, EPS, and cash flow improvements, yet it has just a 5.8% forward revenue growth rate, which is a drag on its Quant rating.
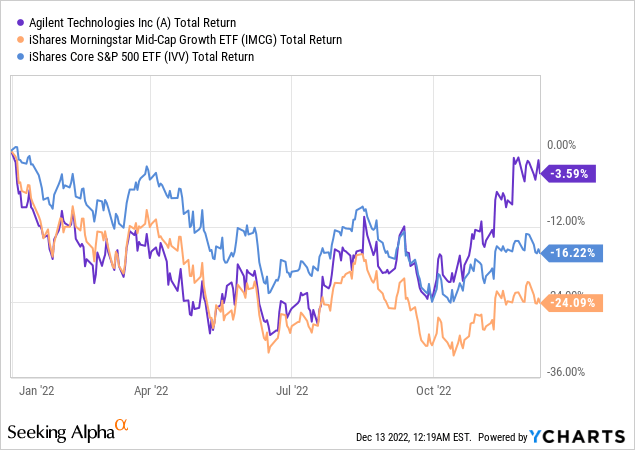
Besides, after a few grossly successful months, the stock looks relatively overvalued compared to the healthcare sector.
Delving deeper, the IMCG portfolio does have a substantial share of stocks capable of delivering solid growth stories. For example, as of my calculations, its weighted-average forward revenue growth rate is around 17.5%, which factors in around 26% of the holdings with over 20% rates. Meanwhile, companies with over 20% forward EPS growth have an even larger weight, of about 45%, clearly a solid result.
Since we are dealing with a predominantly large-cap mix, something to dislike should be expected on the valuation side. Unsurprisingly, less than 5% of the holdings have a Quant Valuation grade of B- or better, well below IWO’s 18.7%, once again illustrating that IMCG bears some size premium. By the same token, overvalued companies account for just 55% of IWO and almost 84% of IMCG.
Turning to the weighted-average LTM earnings yield, it stands a just 2.6% (implying a massive P/E of 37.9x), again reflecting the growth and size premia. Please take notice that more than 12% of the fund’s net assets are allocated to loss-making companies, and the figure above was computed using negative P/Es also. Meanwhile, Enterprise Value/Sales and Price/Sales offer little solace, standing at 6.7x and 6.3x, respectively.
IMCG portfolio does not have profound quality issues, yet there are nuances to dislike
In many cases, growth-heavy equity portfolios suffer from fickle quality as companies that are expanding at a rapid pace have to pour hefty funds into opex, in many cases including burdensome Research & Development expenses, especially when it comes to IT or communication services, and of course, capex (principally in the cases of energy or industrials) to secure future sales and cash flow growth. Thankfully, this is not the case with IMCG. The fund has a level of quality typical for a large-cap-heavy mix, though there are still nuances not to overlook.
Overall, I see close to 82% of the net assets allocated to stocks with at least a B- Quant Profitability grade, a decent result. For context, IWO has just about 57%; another way of saying, a meaningful share of its holdings has below-median margins and capital efficiency compared to their respective sectors.
At the same time, over 13% of IMCG’s net assets are allocated to loss-making companies like Five9 (FIVN), while around 7% are EBITDA-negative, a disappointment, though a level acceptable for a fund targeting growth.
Final thoughts
IMCG offers an interesting large-cap heavy mix with a weighted-average forward revenue growth rate of about 17.5% and large exposure to highly profitable companies.
During the April 2021 – November 2022 period (since the investment strategy change), it delivered a negative 5% return, substantially underperforming IVV. This is principally the consequence of the growth style falling out of favor with investors this year, while IVV has been propped up somewhat by its exposure to cheaper equities that have experienced something of a renaissance that began in 2021, a phenomenon typically called a capital rotation.
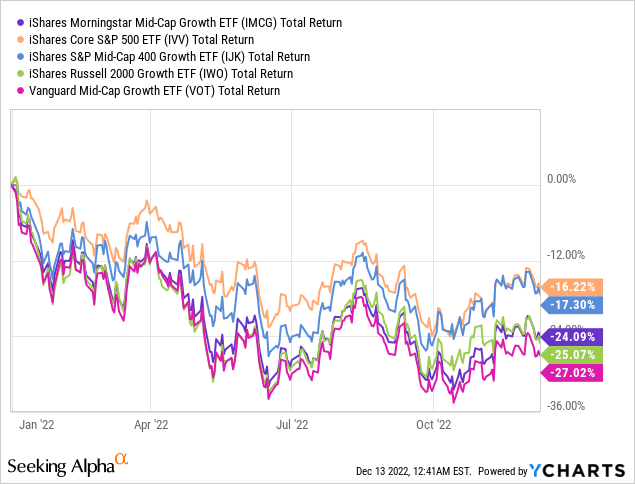
Interestingly, as can be noticed from the table below, IMCG’s compound annual growth rate is similar to the one delivered by the Vanguard Mid-Cap Growth ETF (VOT) and iShares S&P Mid-Cap 400 Growth ETF (IJK), yet in stark contrast with IWO.
| Portfolio | IWO | IMCG | IVV | IJK | VOT |
| Initial Balance | $10,000 | $10,000 | $10,000 | $10,000 | $10,000 |
| Final Balance | $7,688 | $9,173 | $10,513 | $9,418 | $9,030 |
| CAGR | -14.60% | -5.04% | 3.05% | -3.53% | -5.94% |
| Stdev | 21.92% | 22.25% | 19.80% | 21.99% | 23.51% |
| Best Year | -2.32% | 16.70% | 21.09% | 9.24% | 18.98% |
| Worst Year | -21.30% | -21.39% | -13.18% | -13.78% | -24.10% |
| Max. Drawdown | -33.55% | -31.59% | -23.93% | -25.49% | -33.18% |
| Sharpe Ratio | -0.65 | -0.17 | 0.2 | -0.1 | -0.18 |
| Sortino Ratio | -0.8 | -0.22 | 0.29 | -0.14 | -0.24 |
| Market Correlation | 0.88 | 0.97 | 1 | 0.95 | 0.96 |
Also, I believe its higher correlation with the market is likely resulting from the ETF’s exposure to large caps.
Summing up, IMCG does have a few advantages, yet I am uncertain whether the combination of the growth and quality factors in a mostly large-cap portfolio heavy in IT and industrials offers an opportunity at the moment. I highlight its expensiveness manifested in overstretched multiples and argue against ignoring valuation at this point.
[ad_2]
Source links Google News