
[ad_1]

champpixs
Article Purpose
In February 2022, I predicted the Vanguard Mega Cap Value ETF (MGV) would outpace the Vanguard Mega Cap ETF (NYSEARCA:MGC) as we advance. My reasoning was fundamentals-based, assessing numerous factors like each fund’s volatility, valuation, growth, and profitability. I also considered downward trends in market sentiment, which ended up being a significant headwind for the more growth-oriented MGC. With just a few short weeks remaining in 2022, MGV has outperformed by 16.67% YTD and 11.22% since my article published.
The purpose of today’s article is to challenge my prior thesis and acknowledge that past performance is unlikely to continue. Indeed, MGC may be an attractive purchase after a 17.91% YTD loss, and I want to discuss its prospects further. I will take the same fundamentals-based approach as before and highlight the advantages and disadvantages of this solid mega-cap blended ETF.
ETF Overviews
How CRSP Indexes Are Designed
Vanguard’s Mega-Cap ETFs track CRSP Indexes with dynamic market capitalization breakpoints. This approach means the breakpoints adjust according to market conditions and arbitrary figures to separate small-, mid-, large-, and mega-cap companies aren’t used. The mega-cap universe is those companies inside the top 70% of the U.S. market capitalization. Buffer rules also exist to limit turnover. For example, as long as a current constituent’s market capitalization is within the top 76% at the time of reconstitution, it remains in the Index. This rule provides greater efficiency, as swapping companies with minuscule weightings adds unnecessary trading costs and likely won’t impact the Index’s overall composition.
The above describes MGC, but CRSP also develops factor-weighted value and growth Indexes tracked by MGV and MGK. For MGV, five factors create a value score for all mega-cap constituents:
- Book To Price Ratio
- Future Earnings To Price Ratio
- Historical Earnings To Price Ratio
- Dividend To Price Ratio
- Sales To Price Ratio
And six factors create a growth score:
- Future long-term growth in earnings per share
- Future short-term growth in earnings per share
- Three-year historical growth in earnings per share
- Three-year historical growth in sales per share
- Current investment-to-assets ratio
- Return on assets ratio
CRSP uses two years’ worth of estimates as reported on the Institutional Brokers’ Estimate System for future earnings. I like that the Index considers forward-looking factors, which is crucial in fast-changing markets.
Sector Exposures and Top Ten Holdings
Morningstar is a good source for sector exposures. It allows for easy apples-to-apples comparisons under Global Industry Classification Standards. Some fund providers show sector exposures under the Industry Classification Benchmark system, which can sometimes be confusing. The table below highlights sector exposures for MGV, MGC, MGK, and the SPDR S&P 500 ETF (SPY). Previously, I’ve written about the similarities between SPY and MGC, and the table below helps explain why.
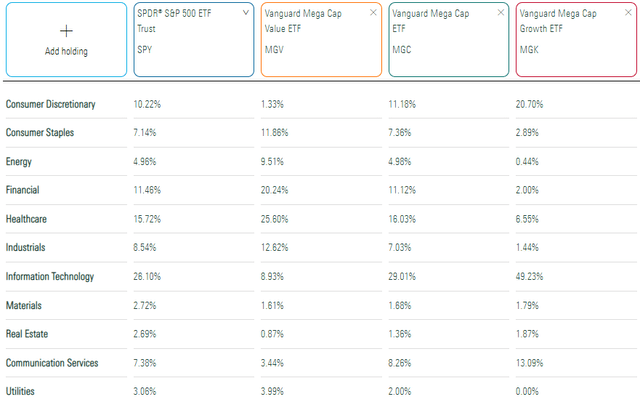
Morningstar
The primary difference between MGC and SPY is that MGC overweights Technology stocks by about 3% (29.01% vs. 26.10%). Even with the Technology Select Sector SPDR ETF (XLK) down 24.19% YTD, mega-cap holdings like Apple (AAPL) and Microsoft (MSFT) still dominate the Index. One interesting data point is that MGC constituents have averaged only an 8.15% price decline YTD. This apparent movement away from the largest companies is cause for concern since most investors own market-cap-weighted ETFs like MGC and SPY.
In addition to Apple and Microsoft, MGC’s top ten holdings include Alphabet (GOOGL, GOOG), Amazon (AMZN), and Tesla (TSLA). These three stocks are down 35.31%, 45.81%, and 50.76% on the year.
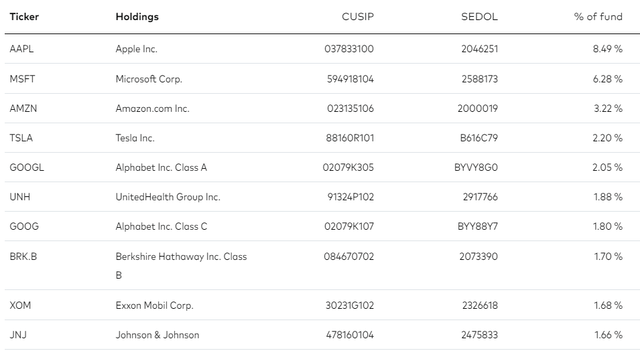
Vanguard
In contrast, MGV’s holdings have held up much better. Led by UnitedHealth Group (UNH), MGV also holds Exxon Mobil (XOM) and Chevron (CVX) and several Health Care companies like Johnson & Johnson (JNJ) and Procter & Gamble (PG). Berkshire Hathaway (BRK.B) is the fourth-largest holding, a well-diversified portfolio on its own. Together, these top holdings total 26.92%.
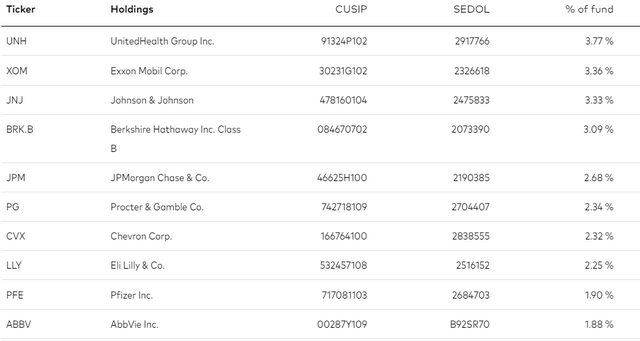
Vanguard
Finally, MGK is easily the least diversified, with its top ten holdings totaling 56.71%, or 58.34%, if Alphabet’s two share classes are combined.
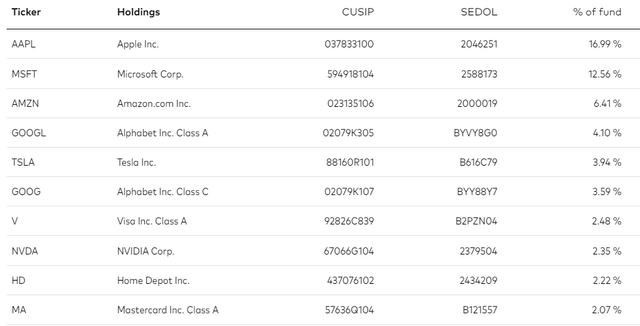
Vanguard
Performance Analysis
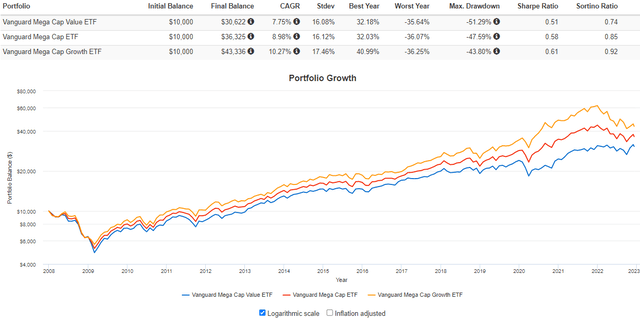
The following graph highlights the performance of MGV, MGC, and MGK since January 2008. Over this period, MGC gained an annualized 8.98%, about in the middle of MGV’s 7.75% and MGC’s 10.27%.
Portfolio Visualizer
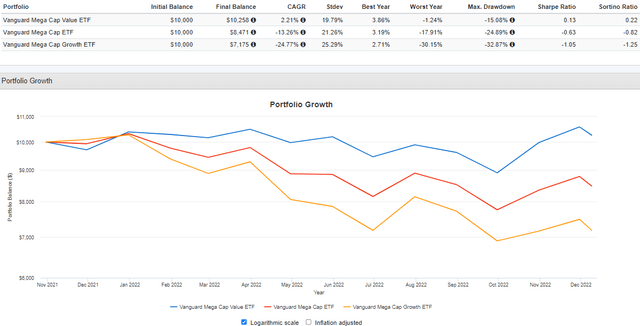
While growth’s long-term performance is terrific, investors may not have recognized the changing market dynamics in late 2021. As companies reported their Q3 2021 earnings around November 2021, it was clear that aggregate S&P 500 earnings surprises would trend downward for the second consecutive quarter. Further confirmation occurred in Q4 2021, and the last three quarters of surprises have hovered around the 5-7% long-term average: 7.3%, 5.9%, and 3.4%. As market sentiment shifted, it made sense to move towards “safer” stocks with lower valuation ratios, like in MGV. Here’s how the three ETFs have performed since November 2021.
Portfolio Visualizer
The critical question is if MGV’s outperformance will continue. To determine this, let’s compare the fundamentals of all three ETFs.
ETF Analysis
MGC Fundamental Snapshot By Company
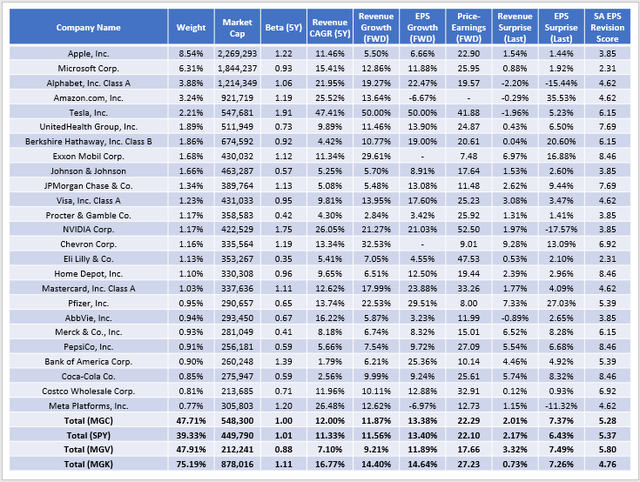
Below are selected fundamental metrics for MGC’s top 25 holdings. The bottom rows are summary metrics for all three mega-cap ETFs. Like its sector allocations, MGC’s fundamentals are between MGV and MGK.
The Sunday Investor
For investors unsure whether to favor value or growth, MGC makes sense. It’s virtually identical to SPY in composition and may be superior in the long run, given how mega-cap companies are highly profitable. Not shown, but MGC’s Profitability Score, based on Seeking Alpha Factor Grades, is 9.68/10 vs. 9.42/10 for SPY. It’s one reason why I have confidence in these companies in the long run, but it’s not always prudent to add at any price. Momentum, measured by last quarter’s sales and earnings surprises and Seeking Alpha EPS Revision Grades, strongly suggests value still has the advantage.
Last quarter, MGV’s holdings “surprised” analysts by 3.32% and 7.49% on sales and earnings, respectively. MGK’s figures were 0.73% and 7.26%, and weaker analyst sentiment is highlighted by the difference in the EPS Revision Scores (5.80/10 vs. 4.76/10). MGC is in the middle at 5.28/10, but in February, the score was 6.38/10. I follow these changes closely, and until I see some stabilization or, ideally, a reversal in analyst sentiment on Wall Street, I don’t recommend “buying the dip” in growth stocks. Besides, MGV may be value-oriented, but its estimated 11.89% earnings growth rate is only 2.75% less than MGK’s 14.64%. MGV trades at just 17.66x forward earnings compared to 27.23x for MGK. For growth-at-a-reasonable-price investors, investing in value makes the most sense.
Key Risk: MGV’s Is More Expensive Than Before
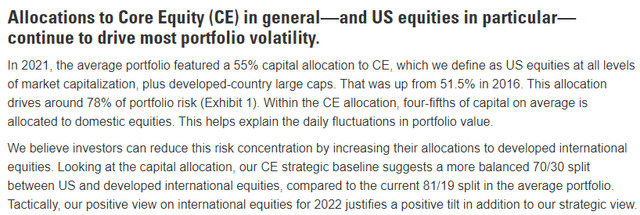
Readers may find it surprising that MGV’s current forward earnings valuation of 17.66x is more expensive than in late February (17.15x). A key reason is a decline in expected earnings growth from 15.36% to 11.89%, so it’s not like value stocks aren’t feeling any pain. They just look better compared to growth stocks, and equity investors aren’t putting their money into other asset classes. According to Goldman Sachs Asset Management, the average 2021 portfolio allocated 55% to “core equities,” up from 51.5% in 2016. Furthermore, U.S. equity allocations are high at 81%, so at least part of why mega-cap value is holding well is because investors feel they have nowhere else to go. I expect 2022’s equity allocation has decreased, but U.S. equities likely still make up a significant part of most investors’ portfolios.
Goldman Sachs Asset Management
Investment Recommendation
Value should outperform growth so long as market sentiment, measured by sales and earnings surprises and EPS revisions, continue trending flat or downward. Q3 2022 S&P 500 earnings surprises were just 3.9% in aggregate, and I think we will need at least two consecutive quarters of better numbers before growth stocks look attractive. That puts us near the end of April, or early May before a switch to growth is warranted. If next quarter’s numbers improve, an ETF like MGC is a good go-between product, but it’s still too early to bet on today. Instead, stick with value stocks with better results and lower valuations, and if you prefer sticking to the highly-profitable mega-cap segment, MGV looks like an excellent and straightforward choice.
[ad_2]
Source links Google News