
[ad_1]
NicoElNino/iStock via Getty Images

IQDG’s strategy and portfolio
The WisdomTree International Quality Dividend Growth Fund (BATS:IQDG) tracks the WisdomTree International Quality Dividend Growth Index. It started investing operations on 04/07/2016. It has a portfolio of 249 stocks, a 12-month distribution yield of 3.17%, and a total expense ratio of 0.42%. Dividends are paid quarterly.
As described in the prospectus by WisdomTree, the underlying index “is comprised of the top 300 companies from the WisdomTree International Equity Index with the best combined rank of growth and quality factors. The growth factor ranking is based on long-term earnings growth expectations, while the quality factor ranking is based on three-year historical averages for return on equity and return on assets. Companies are weighted in the Index based on annual cash dividends paid“. The index excludes Canada and the U.S.
The fund invests mostly in Europe (79% of asset value) and in large companies (82%). The next chart lists the countries weighting more than 1% of asset value, which represents an aggregate weight of 97%. Switzerland and the U.K. are almost on par at about 18%, followed by France (13.2%) and Japan (8.4%). Hong Kong weighs 3.8%: direct exposure to geopolitical and regulatory risks related to China is low.
IQDG countries (Chart: author; data: WisdomTree)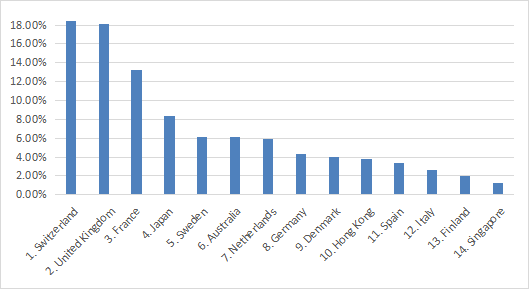
The fund is quite balanced in the top 3 sectors: healthcare (19.5%), consumer staples (19.4%), and consumer discretionary (18.7%). Then, come industrials (14.5%) and technology (11.7%). Other sectors weigh no more than 5% individually and 16% together.
IQDG sectors (Chart: author; data: WisdomTree)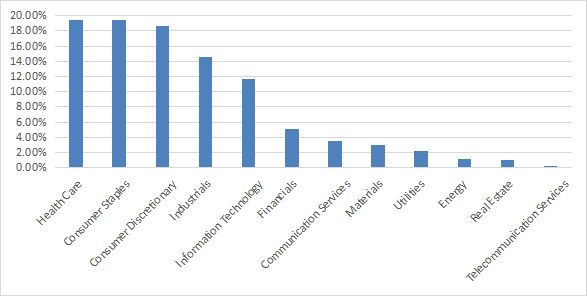
The fund has over 200 holdings, but it is not widely diversified: the top 10 names, listed below with some fundamental ratios, represent over 37% of asset value. The top 5 companies weigh over 4% each.
|
US Ticker |
Held Ticker |
Name |
Weight |
EPS Growth % TTM |
P/E TTM |
P/E fwd |
Yield % |
|
OTCPK:LVMUY |
MC FP |
LVMH Moët Hennessy Louis Vuitton SE |
5.57% |
32.52 |
25.52 |
26.24 |
1.65 |
|
UL |
ULVR LN |
Unilever PLC |
4.71% |
3.55 |
19.68 |
19.01 |
3.57 |
|
NVS |
NOVN SW |
Novartis AG |
4.30% |
124.29 |
9.29 |
15.15 |
3.66 |
|
GSK |
GSK LN |
GSK plc |
4.21% |
177.92 |
4.36 |
11.09 |
5.19 |
|
OTCPK:NSRGY |
NESN SW |
Nestlé S.A. |
4.15% |
29.98 |
18.43 |
23.70 |
2.53 |
|
OTCPK:IDEXY |
ITX SM |
Industria de Diseño Textil, S.A. |
3.21% |
36.90 |
19.12 |
N/A |
3.67 |
|
OTCQX:RHHBY |
ROG SW |
Roche Holding AG |
3.05% |
6.23 |
17.04 |
15.17 |
3.04 |
|
NVO |
NOVOB DC |
Novo Nordisk A/S |
2.74% |
4.80 |
38.19 |
38.58 |
1.24 |
|
OTCPK:LRLCY |
OR FP |
L’Oréal S.A. |
2.68% |
28.36 |
33.28 |
33.90 |
1.35 |
|
SAP |
SAP GY |
SAP SE |
2.65% |
-48.10 |
35.78 |
23.60 |
1.94 |
Past performance compared to competitors
The next table compares IQDG’s performance since 04/13/2016 with four international dividend growth ETFs:
- The Invesco International Dividend Achievers ETF (PID), reviewed here.
- The Vanguard International Dividend Appreciation ETF (VIGI), reviewed here.
- The WisdomTree Global ex-U.S. Quality Dividend Growth (DNL), reviewed here.
- The iShares International Dividend Growth ETF (IGRO), reviewed here.
|
Since 4/13/2016 |
Total Return |
Annual.Return |
Drawdown |
Sharpe |
Volatility |
|
IQDG |
48.51% |
6.11% |
-35.54% |
0.34 |
17.06% |
|
IGRO |
42.45% |
5.45% |
-35.30% |
0.34 |
16.42% |
|
PID |
53.67% |
6.66% |
-43.36% |
0.37 |
18.32% |
|
VIGI |
52.83% |
6.57% |
-30.29% |
0.44 |
14.60% |
|
DNL |
64.78% |
7.78% |
-35.92% |
0.45 |
17.27% |
Data calculated with Portfolio123, reinvesting dividends.
IQDG is second to last in total return. As a reference, SPY has returned 113% in the same time (12% annualized). In 2022 to date, IQDG is also second to last in the same group (see next chart).
IQDG vs. competitors in 2022 (Portfolio123)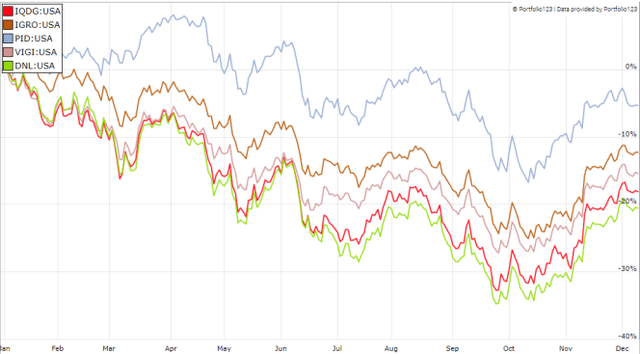
Distribution history shows an increase in annualized values since 2017, with occasional setbacks (see next table). The augmentation from 2020 to 2021 (+76.6%) is not indicative of the future trend.
|
2017 |
2018 |
2019 |
2020 |
2021 |
|
0.52372 |
0.49206 |
0.62179 |
0.60295 |
1.06509 |
Takeaway
IQDG holds 249 dividend stocks, mostly large caps from developed countries. Europe represents 79% of asset value. The top 3 countries are Switzerland, the U.K., and France. The fund is well-diversified across sectors, but it is quite concentrated in the top 10 holdings (37%). Historical performance is underwhelming: IQDG has been lagging behind at least 3 international dividend growth ETFs since inception, as well as in 2022. For transparency, a dividend-oriented part of my equity investments is split between a passive ETF allocation (IQDG is not part of it) and my actively managed Stability portfolio (14 stocks), disclosed and updated in Quantitative Risk and Value.
[ad_2]
Source links Google News