[ad_1]
Why I Still Own MORL
As described in my 2013 Seeking Alpha article, “A Depression With Benefits: The Macro Case For mREITs,” my macroeconomic rationale for investing in UBS ETRACS Monthly Pay 2X Leveraged Mortgage REIT ETN (MORL) – the only 2X-leveraged mREIT ETN in existence at that time – was based on the premise that government policies shifting the tax burden from the rich and onto the middle class results in much more funds being available for investment relative to productive uses for those investable funds. That tends to put downward pressure on interest rates.
MORL and, later, UBS ETRACS Monthly Pay 2X Leveraged Mortgage REIT ETN Series B (MRRL) and the Credit Suisse X-Links Monthly Pay 2x Leveraged Mortgage REIT ETN (NYSEARCA: REML) have been the primary instruments by which I have attempted to utilize my longer-term macroeconomic outlook to manage a high current yield portfolio given some very significant constraints. The most important constraint is to only include securities with current yields above 15%. Other constraints are the typical retail IRA account restrictions which preclude the use of margin borrowing and futures contracts. I suspect that there are many individuals, particularly those either partially or totally retired, who either have somewhat similar constraints or could possibly benefit from adopting them.
Given those constraints, the universe of possible investments is very limited. Other than junk bonds and other securities issued by individual distressed entities, in order to meet the 15%+ constraint, my primary investment focus in the quest for 15%+ current yield has been and is, on 2x Leveraged High-Yield ETNs.
I have utilized UBS ETRACS Monthly Pay 2x Leveraged Closed-End Fund ETN (CEFL) and UBS ETRACS 2xLeveraged Long Wells Fargo Business Development Company ETN (BDCL) as diversifiers and for hedging possible macroeconomic outcomes. As I discussed in New Risks Appear For 2X-Leveraged mREITs, in November, 2019, I added ETRACS Monthly Pay 2x Leveraged U.S. Small Cap High Dividend ETN (NYSEARCA:SMHD) The yield on SMHD usually exceeded both CEFL and BDCL and was only slightly less than MORL.
I took a small long position in SMHD based on the supposition that an interesting aspect of SMHD is that it may be diversifier for CEFL. This is because closed-end funds are excluded from SMHD. Originally, I looked at SMHD as a diversifier for MORL since SMHD has many equity issues that might do well in an environment of higher levels of economic activity. However, SMHD has a fairly large number of mREITs that are also in MORL. Since SMHD excludes closed-end funds there is no overlap with CEFL.
After UBS AG (UBS) created MRRL, which is essentially an identical twin to MORL, I bought some MRRL. For a short while, Fidelity allowed purchases of MRRL after they stopped allowing purchases of MORL and the other UBS 2x Leveraged High-Yield ETNs. In other brokerage accounts, I would buy either MORL or MRRL whichever was cheaper. Initially, trading was very thin in MRRL. This allowed MRRL to trade either above or below MORL for short periods, as it hit air pockets. There were a few times when the spread between MORL and MRRL approached $0.20 and I was able to switch back and forth between them.
Until September 6, 2018, MORL and MRRL usually traded very close to each other and to their net indicative (asset) value which is identical for both. The price relationship between MORL and MRRL changed after September 6, 2018. UBS then announced that they would no longer issue any new shares of MORL. While typically called “shares” ETNs are actually notes. The price of MRRL has continued to closely track net asset value since that announcement. However, MORL began trading far above MRRL (and the net asset value of both). The spread between MORL and MRRL eventually widened out to $0.97 on September 17, 2018.
This enormous spread prompted my article: Sell MORL, Buy MRRL which included:
..Just because MORL can possibly trade at a significant premium to net asset value does not mean that it should. This is especially true since the identical twin MRRL is still available at very close to net asset value. There may be some sort of a short-squeeze occurring in MORL. These are dangerous to participate in from either side. However, some short-term traders may want to get involved. For investors who own high yielding 2X leveraged ETNs for the very high current yields. If they are making a new purchase, MRRL is a better buy than MORL at present prices. Those that own MORL may want to take advantage of the historic spread and sell MORL and use the proceeds to buy MRRL…
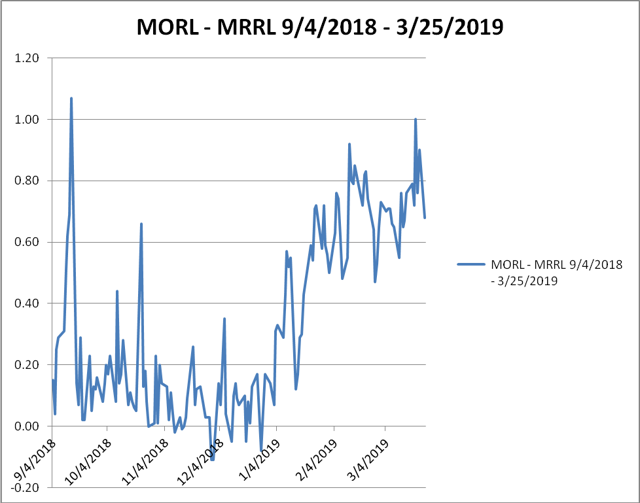
The spread between MORL and MRRL narrowed dramatically soon after the article appeared on Seeking Alpha. The spread has bounced around since then, with MORL generally trading higher than MRRL, but until recently not approaching the spread levels seen on Friday, September 17, 2018, and on Monday, September 20, 2018, prior to the article appearing on Seeking Alpha. Chart I below shows the MORL – MRRL spread for the last three years. Chart II below shows the MORL – MRRL spread for the last six months, which is more relevant and useful since it incorporates the period after September 6, 2018.
Chart I
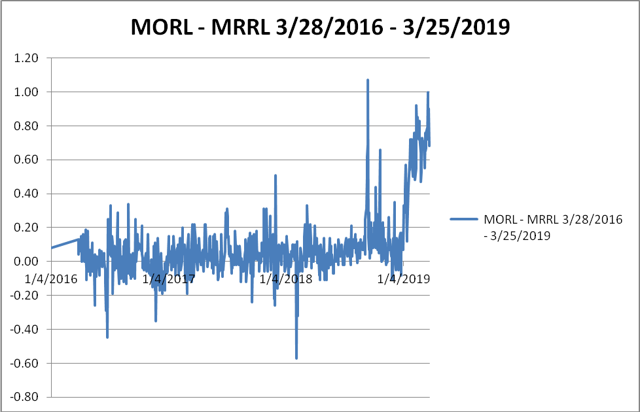
Chart II
Trading Out of MORL into MRRL
Generally, an investor now initiating or adding to a position in UBS ETRACS Monthly Pay 2X Leveraged Mortgage REIT ETNs either MORL or MRRL should buy whichever one is cheaper at the time. That has been MRRL for at least the last six months. Likewise, a seller, that owned both should sell the higher priced one. That has been MORL for at least the last six months. A trader trying to arbitrage the spread between might attempt to buy MORL when the spread was very close to the low end a range, with the hope of reversing into MRRL at some later date when the spread was higher.
Those investors that already own MORL, have a more complex situation. Any time one sells MORL and uses the proceeds to buy MRRL, they pick up yield and value as long as the price of MORL exceeds that of MRRL. However, they give up the opportunity of selling MORL at an even higher spread at a later date. One method of addressing the timing issue is basing the trades on the standard deviation of the spread. From the period September 4, 2018 through to March 25, 2019, shown on Chart II above, the average value of the MORL – MRRL spread was $0.334. The highest spread was $1.07 and the lowest -$0.11. The standard deviation was 0.298. If we assume that the spreads are normally distributed, then 95% of the time the spread should be within about 2 standard deviations from the mean. Thus, when the spread exceeds (2 x 0.298) + 0.334 = 0.93, it would appear an attractive point to sell MORL and use the proceeds to buy MRRL. Additionally, it would seem to be a good idea to not execute all of your position at one time as long as you have a large enough position that transaction costs are not a significant issue. Likewise, if your position is so large that executing all of you position at one time would result in only partial fills at various prices, it would also seem to be a good idea to not execute all of you position at one time.
Trading Out of SMHD into SMHB
On October 09, 2018, UBS announced that it has suspended further sales from inventory of SMHD. Until then SMHD had traded very close its indicative (net asset) value. Suspending further sales from inventory put SMHD in the same category as MORL, in that it can now trade significantly above its indicative (net asset) value. However, MORL had and still has an essentially identical twin MRRL that is still being created. Initially there was no twin of SMHD. On November 8, 2018, UBS ETRACS Monthly Pay 2xLeveraged US Small Cap High Dividend ETN Series B (SMHB) started trading. That presented an arbitrage opportunity involving SMHD and SMHB.
While MRRL and MORL are essentially identical, SMHD and SMHB are based on the same index and thus have identical components, their base levels are not identical. Thus, on March 25, 2019 SMHD closed at $13.73 while SMHB closed at $20.40. The existence of SMHB now presents an arbitrage opportunity, but the disparate price levels make it not as obvious as the MORL – MRRL situation. In order to determine the extent that SMHD is trading relatively more than SMHB, a conversion calculation is necessary.
The net indicative (asset) values and dividends of SMHD and SMHB will always move exactly the same in terms of percentage changes. SMHB will always have a net indicative (asset) value and dividend that is very close to 1.53 times that of SMHD. While typically called dividends, the payments from the 2x Leveraged High-Yield ETNs are technically distributions of interest payments on the ETNs, based on the dividends paid by the underlying securities that comprise the index upon which each of them is based, pursuant to the terms of the indentures.
A minor technicality, which has caused some confusion, is that because SMHB started trading on November 8, 2018, the dividend paid by SMHB on December 24, 2018 of $0.1696 was slightly less than it would be based on the 1.53 ratio between the net asset values of SMHB and SMHD. The dividend paid by SMHD on December 24, 2018 was $0.1459, $0.1696/$0.1459 = 1.162. This will no longer be an issue, since all dividends paid by SMHB after December 24, 2018 will be extremely close to 1.53 times all dividends paid by SMHD. For example, the March 2019 SMHB dividend of $0.1634 was 1.527 times the $0.107 paid by SMHD.
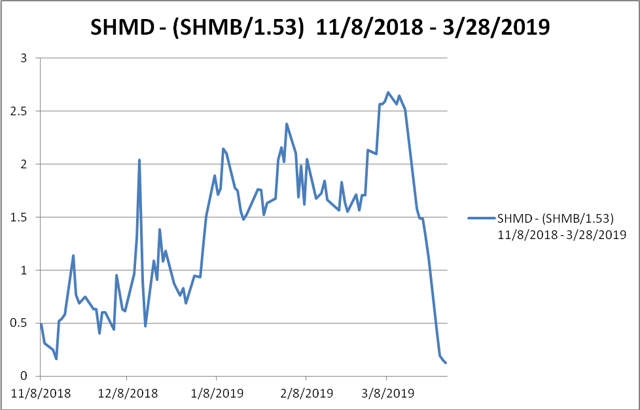
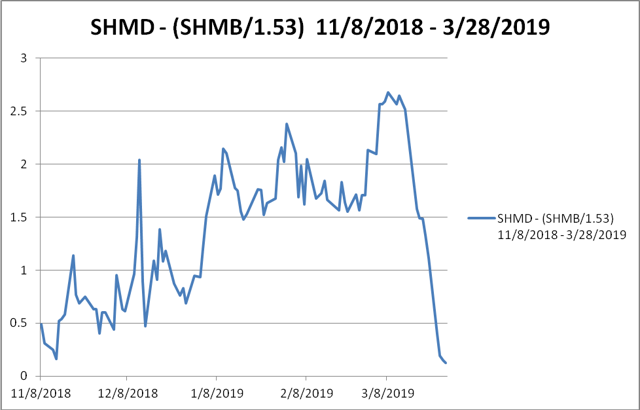
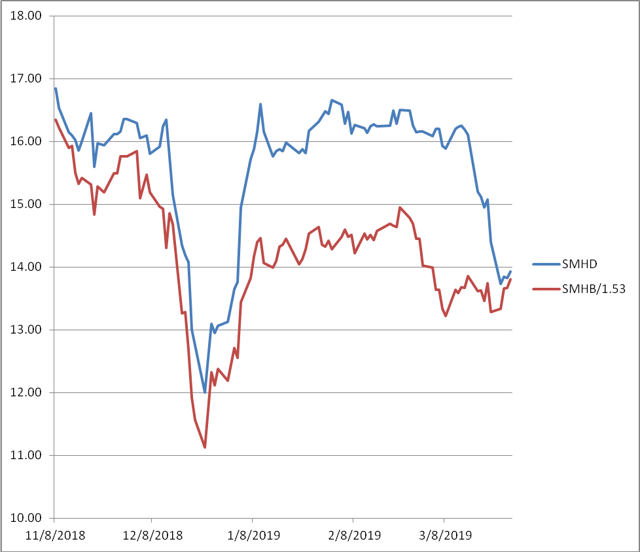
Dividing SMHB by 1.53 puts its magnitude on the same scale as SMHD. Subtracting, the price of SMHB/1.53 from the price of SMHD gives a useful ratio. For March 28, 2019 when SMHD closed at $13.93 and SMHB closed at $21.12 this calculation is $13.93 – ($21.12/1.53) = $0.126. This was lowest spread since SMHB began trading. This spread has been a very volatile series and was at an all-time high of $2.674 on March 8, 2019. The significant range difference and presents an arbitrage opportunity. For the series: SMHD – (SMHB/ 1.53), the observed standard deviation is 0.612 and the mean is 1.628. Thus, the mean minus two standard deviations is 1.628 – (2 x 0.612) = 0.404. The mean plus two standard deviations is 1.628 – (2 x 0.612) = 2.852. This suggests that selling SMHD and buying SMHB when SMHD – (SMHB/ 1.53) is near 2.85 is an excellent trade. For those very nimble, reversing it at something less than 0.4, with the objective of making $2 might be considered.
The Chart III below shows the spread between SMHD and the calculated equivalent value of SMHB since October. Note that the actual values of SMHB are used for the period after December 6, 2018. For the prior period, a synthetic value based on the net asset value of SMHD is used.
Chart III
The actual values of SMHD and SMHB/1.53 are shown below on Chart IV
Trading Out of MORL into SMHB
The index upon which SMHD and SMHB are based has a fairly large number of mREITs that are also in MORL. While MORL and SMHB can trade significantly above their net indicative (asset) values. MRRL and SMHB cannot trade significantly above their net indicative (asset) values, as long as new notes are being created. This presents an opportunity for holders of MORL to switch into SMHB and pick-up yield and value. This may be of particular interest to those who hold MORL in accounts at Fidelity. Fidelity does not allow new purchases of MRRL, but it does allow new purchases of SMHB.
Trading between MORL and SMHB is risk arbitrage as opposed to the essentially riskless arbitrage involved in trading between MORL and MRRL or SMHD and SMHB. Since MORL and SMHB only have some but not all components in common, there will be drift between the two, separate from the relationship between MORL and its’ net indicative (asset) values. The objective in trading out of MORL and SMHB, it to sell a note that is trading significantly above net indicative (asset) values and into ones that are priced very close to net indicative (asset) values. Arbitrage occurs when the two things being traded are similar and are expected to move similarly. Riskless arbitrage involves trading things that essentially identical such as MORL and MRRL. Risk arbitrage involves non-identical, but related things MORL and SMHB. There are various parameters that can be used to quantify the relationship between MORL and SMHB. One parameter is the difference between SMHB and MORL. That is shown below in Chart V
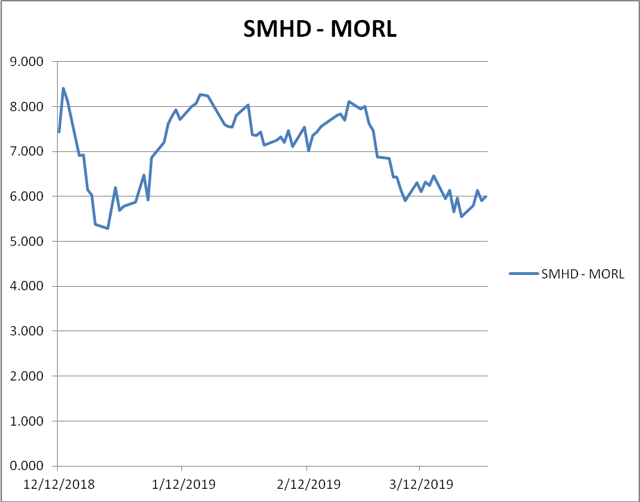
If you sold MORL on December 24, 2018 at$11.70 and bought SMHB at $16.98 for a difference of $5.28, you could have reversed it on January 2, 2019 when MORL closed at $!3.65 and SMHB at $21.92, a difference of $5.28. However, a substantial part of the increase in the SMHB – MORL spread could be attributed to the sharp increase in both SMHB and MORL over that period. To eliminate movement in the spread caused by changes in the magnitude of both, the spread could be divided by SMHB. That is shown below in Chart VI.
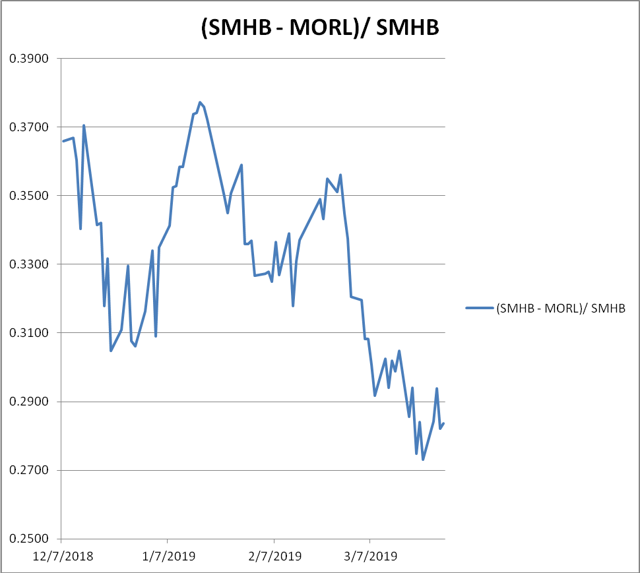
Chart VI suggests that the best time to have sold MORL and bought SMHB was on March 22, 2019 when the value of (SMHB – MORL)/ SMHB was only .273. On March 22, 2019 MORL closed at $14.78 a spread of $0.90 over MRRL which closed at $13.88. MORL’s price was also $0.94 above the $13.84 net indicative (asset) value of MORL and MRRL. On that day SMHB’s price of $20.33 was very close to the SMHB net indicative (asset) value of $29.28. Thus, selling MORL and buying SMHB, got you out of a UBS ETRACS Monthly Pay 2X Leveraged ETN that was selling at 6.8% above net indicative (asset) value and into one selling at only 0.2%. The one thing that is certain about the 2X Leveraged ETNs is that eventually they will be worth net indicative (asset) value. For the series: (SMHB – MORL)/ SMHB, the observed standard deviation is 0.0275 and the mean is 0.3276. Thus, the mean minus two standard deviations is 0.3276 – (2 x 0.0275) = 0.2726. That also suggests March 22, 2019 was a good day for selling MORL and buying SMHB.
Analysis Of The April 2019 MORL And MRRL Dividend Projection
My projected April 2019 MORL and MRRL monthly dividend of $0.5166 is a function of the calendar. Most of the MORL and MRRL components pay dividends quarterly, typically with ex-dates in the last month of the quarter and payment dates in the first month of the next quarter. The January, April, October and July “big month” MORL and MRRL dividends are much larger than the “small month” dividends paid in the other months. Thus, the $0.5166 MORL and MRRL dividend paid in April 2019 will be a “big month” dividend.
As can be seen in the table below, only four of the MORL and MRRL components – AGNC Investment Corp. (AGNC), Colony Credit Real Estate (CLNC), ARMOUR Residential REIT (ARR) and Dynex Capital Inc. (DX) – now pay dividends monthly. There are some of the quarterly payers that will not contribute to the April 2019 dividend. New Residential Investment Corp (NRZ) has an ex-date of 4/3/2019. Pennymac Mortgage Investment (PMT) has an ex-date of 4/12/2019. Arbor Realty Trust Inc (ABR) had an ex-date of 2/28/2019. Thus, those three quarterly payers will not contribute to the April 2019 dividend. This typically makes the April MORL and MRRL monthly dividend smaller than the other big month dividends. The table below shows the ticker, name, weight, dividend, and ex-date for all of the components. Additionally, the table includes the price and contribution to the dividend for the MORL and MRRL components that will contribute to the April 2019 dividend.
The VanEck Vectors Mortgage REIT Income ETF (MORT) is a fund that is based on the same index as MORL and MRRL. MORT pays dividends quarterly rather than monthly. As a fund, the dividend is discretionary by the fund management as long as it distributes the required percentage of taxable income to maintain its investment company status. Thus, it does not lend itself to dividend projections as an ETN like MORL or MRRL, which must pay dividends pursuant to an indenture.
Conclusions And Recommendations
There are two 2x-leveraged ETNs, MORL and SMHD that at times trade far above their respective net indicative (asset) values. Generally, new purchasers should avoid MORL and SMHD, in favor of MRRL and SHMB, 2X-leveraged monthly pay ETNs that are based on the same indexes as MORL and SMHD respectively. Holders of MORL and SMHD should consider when to switch to MRRL and SHMB. Selling MORL or SMHB and using the proceeds to buy MRRL and SHMB will usually result in an immediate increase in current yield. However, waiting for the spread to be even more favorable could be even more advantageous. This suggests that not switching your entire position at any one time may be a better course of action.
More sophisticated traders might try to trade both ways when the spreads deviate from the means by close to two standard deviations. Likewise, traders may want to play the spread between MORL and SMHB. as discussed in The Most Bullish Thing For A 2X Leveraged High-Yield ETN. Holders of 2x-leveraged ETNs have usually experienced a windfall when the sponsor ceases sales of newly created notes, and a twin 2X-leveraged ETN, based on the identical index exists. Holders of such 2x-leveraged ETNs should recognize that a potential windfall exists and consider what strategies they will employ to take advantage of the potential windfall. It should be kept in mind, that the windfall will disappear, if the old 2x-leveraged ETNs are held long enough, since at some point all 2x-leveraged ETNs will be only worth above their respective net indicative (asset) values. This will be when they are redeemed, either prior to maturity or at maturity.
As described in my 2013 Seeking Alpha article, “A Depression With Benefits: The Macro Case For mREITs,” my macroeconomic rationale for investing in MORL – the only 2X-leveraged mREIT ETN in existence at that time – was based on the premise that government policies shifting the tax burden from the rich and onto the middle class results in much more funds being available for investment relative to productive uses for those investable funds. That puts downward pressure on interest rates.
Whatever one thinks of the advisability of enacting legislation that reverses the massive shift in the tax burden away from the rich and onto the middle class, it could have negative implication for the financial markets. Since shifting the tax burden from the rich and onto the middle class results in there being more funds being available for investment, reversing that results in less funds being available for investment.
My focus in this article is not to examine the merits or feasibility of these proposals, or if the amounts that advocates claim would be raised from such taxes on the rich are accurate. I do think there is a reasonable likelihood that the 2020 Democratic nominee for president will be someone who favors, to a greater or less extent, something along the lines of the “tax the rich” plans being recently proposed by Warren and Ocasio-Cortez.
The probability of the 2020 election resulting in a change in the tax code that significantly reverses the massive shift in the in the tax burden away from the rich and onto the middle class is still very probably low as long as the Democrats continue to combine such tax proposals with plans to spend the proceeds on various social programs like free college tuition. However, a plan to raise taxes on those with assets above $50 million and/or incomes above $10 million and use all of the proceeds to reduce the taxes on everyone else might have a much higher probability of being enacted.
It is hard to envision the Democrats being politically savvy or ideologically flexible enough to embrace a policy of directly shifting the tax burden away from the middle class and onto the rich. The Democrats have generally been deluded in their belief that the current level of taxes on the middle class is politically sustainable. In Hilary Clinton’s speech announcing her candidacy, she said that the middle class pays too much taxes. She never mentioned a middle class tax cut again. Presumably due to pressure from Sanders, who pushed her to the left, which severely hurt her chances in the general election.
Most Democrat politicians are not aware that by far the best thing government could do for most middle-class households would be to lower their taxes. Thus, in many cases, middle-class voters have been willing to grasp at any chance they think could lower their tax burden, and thus support candidates who promise them a tax cut, no matter how odious the candidates might be otherwise.
On balance, I still tend to believe that the massive tax policy-induced increase in inequality will cause increasing excesses of loanable and investable funds, above commercially reasonable ways to utilize those funds. This will eventually result in an over-investment cycle with a recession, and that will ultimately be very good for the mREITs and 2X-Leveraged ETNs based on mREITs. However, there does exist now some possibility that there may be some reversal of the shift in the tax burden away from the rich and onto the middle class. This risk has arisen as a result of positions taken by some prominent Democrats advocating taxes on the very rich. There are other significant risks as well.
One consideration is that that it is unlikely that 2X Leveraged Mortgage REIT ETNs will pay their $25 face value at maturity. They will pay whatever the net indicative (asset) value is at the maturity date. That is not as scary as it might sound.
As is explained in “Applying Net Present Values And Internal Rates Of Return To 2X-Leveraged ETNs Yielding More Than 20%“:
…That the net indicative (asset) value and dividends from a 2x Leveraged High-Yield ETN should be expected to decline over time can be a cause of concern or even scary. However, understanding that this is due to the fact that expenses and fees are deducted from the net indicative (asset) value of a 2x Leveraged High-Yield ETN, rather than the income, should alleviate some of the concern. Deducting the fees and expenses from income rather than principal would not impact the actual returns received from investing in 2x Leveraged High-Yield ETNs. The expected decline over time of the net indicative (asset) value and dividends is a consideration. However, once the magnitude of this factor is understood, it should not be much of an impediment to investing in these 2x Leveraged High-Yield ETNs…
The price relationship between MORL and MRRL changed after September 6, 2018. UBS announced that they would no longer issue any new shares of MORL. The price of MRRL has continued to closely track net asset value since that announcement. However, MORL began trading far above MRRL (and the net asset value of both). The spread between MORL and MRRL eventually widened out to $0.97 on September 17, 2018.
The spread between MORL and MRRL narrowed dramatically soon after the article appeared on Seeking Alpha. The spread has bounced around since then, with MORL generally trading higher than MRRL. Recently, the spread has widened out again, reaching $1.00 on a closing basis on March 20, 2019. That the spread has widened out has surprised some observers, including me. After peaking at 2.674 on March 8. 2019, the SMHD – (SMHB/1.53) parameter fell to only 0.0126 as of March 8. 2019. This action in SMHD appeared to be also the result of some Seeking Alpha articles such as: Which Of These 15%-Plus Yielders Should I Buy: SMHD Or SMHB? by Rida Morwa. If the pattern set by MORL and MRRL holds, there will be other opportunities regarding the SMHD – (SMHB/1.53), just as there was after my article temporarily collapsed the MORL – MRRL spread.
Some large market participants may be able to profit easily from the spreads that are presenting arbitrage opportunities involving 2x leveraged high-yield ETNs. Brokerage firms that have hypothecated shares in their customers’ accounts can usually short those shares and receive the proceeds of the short sale. It would be very profitable to short the higher priced 2x leveraged high-yield ETN and buy the lower priced one of the pair and just collect the difference in yield. Using the actual prices when Sell SMHD Yielding 21.5%, Buy SMHB Yielding 23.6%. was written, a firm that could short SMHD and simultaneously buy SMHB could collect 2.1% on the notational amount of the transaction indefinitely and also get a capital gain at maturity or when the prices eventually converged so that SMHB was equal to SMHD x 1.53. This would not require any outlay of cash if hypothecated shares were shorted.
The phenomena of the old 2x leveraged high-yield ETN trading significantly above its net indicative (asset) value, after new sales are suspended, while the new one trades very close to its net indicative (asset) value, means that the holders of the old 2x leveraged high-yield ETN can possibly receive a windfall when new sales of it are suspended. Thus, a consideration when choosing how much of any 2x leveraged high-yield ETN to own is the probability that sales might be suspended by the issuer at some point in the future.
One reason that sales might be suspended by the issuer, could be to allow its brokerage arm to generate essentially risk free income that would not require any outlay of cash, if hypothecated shares were shorted. I think it is likely that some customers of UBS might have hypothecated shares of 2x leveraged high-yield ETNs in their accounts. Paine Webber, a large retail brokerage firm, was acquired by UBS in 2000. See The Most Bullish Thing For A 2X Leveraged High-Yield ETN. For a discussion of why CEFL might be a candidate to have new sales suspended and a new version issued.
MORL And MRRL Components And Contributions To The Dividend
|
Annaly Capital Management Inc |
NLY |
13.56 |
10.25 |
3/28/2019 |
0.3 |
q |
0.10986 |
|
American Capital Agency Corp |
AGNC |
9.49 |
18 |
3/28/2019 |
0.18 |
m |
0.02627 |
|
Starwood Property Trust Inc |
STWD |
6.18 |
22.6 |
3/28/2019 |
0.48 |
q |
0.03633 |
|
New Residential Investment Corp |
NRZ |
6.15 |
16.59 |
4/3/2019 |
0.5 |
q |
|
|
Chimera Investment Corp |
CIM |
4.97 |
19.02 |
3/28/2019 |
0.5 |
q |
0.03616 |
|
Two Harbors Investment Corp |
TWO |
4.89 |
13.8 |
3/28/2019 |
0.47 |
q |
0.0461 |
|
Blackstone Mortgage Trust Inc |
BXMT |
4.85 |
34.6 |
3/28/2019 |
0.62 |
q |
0.02406 |
|
MFA Financial Inc |
MFA |
4.63 |
7.22 |
3/28/2019 |
0.2 |
q |
0.0355 |
|
Invesco Mortgage Capital Inc |
IVR |
4.58 |
16.09 |
3/28/2019 |
0.45 |
q |
0.03546 |
|
Ladder Capital Corp |
LADR |
4.33 |
16.73 |
3/8/2019 |
0.34 |
q |
0.02436 |
|
Apollo Commercial Real Estat |
ARI |
4.33 |
18.36 |
3/28/2019 |
0.46 |
q |
0.03003 |
|
Hannon Armstrong Sustainable Infrastructure Capital Inc |
HASI |
4.27 |
25.11 |
4/2/2019 |
0.335 |
q |
|
|
Colony Credit Real Estate Inc – A |
CLNC |
4.14 |
15.58 |
3/28/2019 |
0.145 |
m |
0.01067 |
|
Pennymac Mortgage Investment |
PMT |
3.15 |
20.42 |
4/12/2019 |
0.47 |
q |
|
|
Arbor Realty Trust Inc |
ABR |
3.04 |
12.83 |
2/28/2019 |
0.27 |
q |
|
|
New York Mortgage Trust Inc |
NYMT |
2.91 |
6.09 |
3/28/2019 |
0.2 |
q |
0.02645 |
|
Redwood Trust Inc |
RWT |
2.38 |
15.8 |
03/14/2019 |
0.3 |
q |
0.01251 |
|
ARMOUR Residential REIT Inc |
ARR |
2.26 |
19.38 |
3/14/2019 |
0.19 |
q |
0.00613 |
|
Granite Point Mortgage Trust Inc |
GPMT |
1.98 |
18.59 |
3/29/2019 |
0.42 |
q |
0.01238 |
|
Capstead Mortgage Corp |
CMO |
1.8 |
8.28 |
3/28/2019 |
0.08 |
q |
0.00481 |
|
Western Asset Mortgage Capital Corp |
WMC |
1.62 |
10.46 |
3/29/2019 |
0.31 |
q |
0.01329 |
|
AG Mortgage Investment Trust Inc |
MITT |
1.33 |
17.35 |
3/28/2019 |
0.5 |
q |
0.01061 |
|
Dynex Capital Inc |
DX |
1.21 |
5.92 |
3/21/2019 |
0.06 |
m |
0.00339 |
|
Anworth Mortgage Asset Corp |
ANH |
1.08 |
4.1 |
3/28/2019 |
0.13 |
q |
0.00948 |
|
Istar Inc |
STAR |
0.88 |
7.84 |
3/1/2019 |
0.09 |
q |
0.0028 |
Disclosure: I am/we are long MORL, MRRL, SMHB, CEFL, BDCL. I wrote this article myself, and it expresses my own opinions. I am not receiving compensation for it (other than from Seeking Alpha). I have no business relationship with any company whose stock is mentioned in this article.
[ad_2]
Source link Google News

