
akinbostanci/E+ via Getty Images
Introduction
The Direxion Daily S&P 500 Bull 3x Shares ETF (NYSEARCA:SPXL) is a leveraged product that attempts to magnify the returns of the S&P 500 on a daily basis; as you may have gleaned from the name, the goal here is to deliver 3x, or 300% of the “daily” returns of the S&P 500 (not 3x the S&P 500’s returns over one week, or one month, or other specific timeframes).
What Type of Investor Is SPXL Good For, And What Are The Risks Associated With This Product?
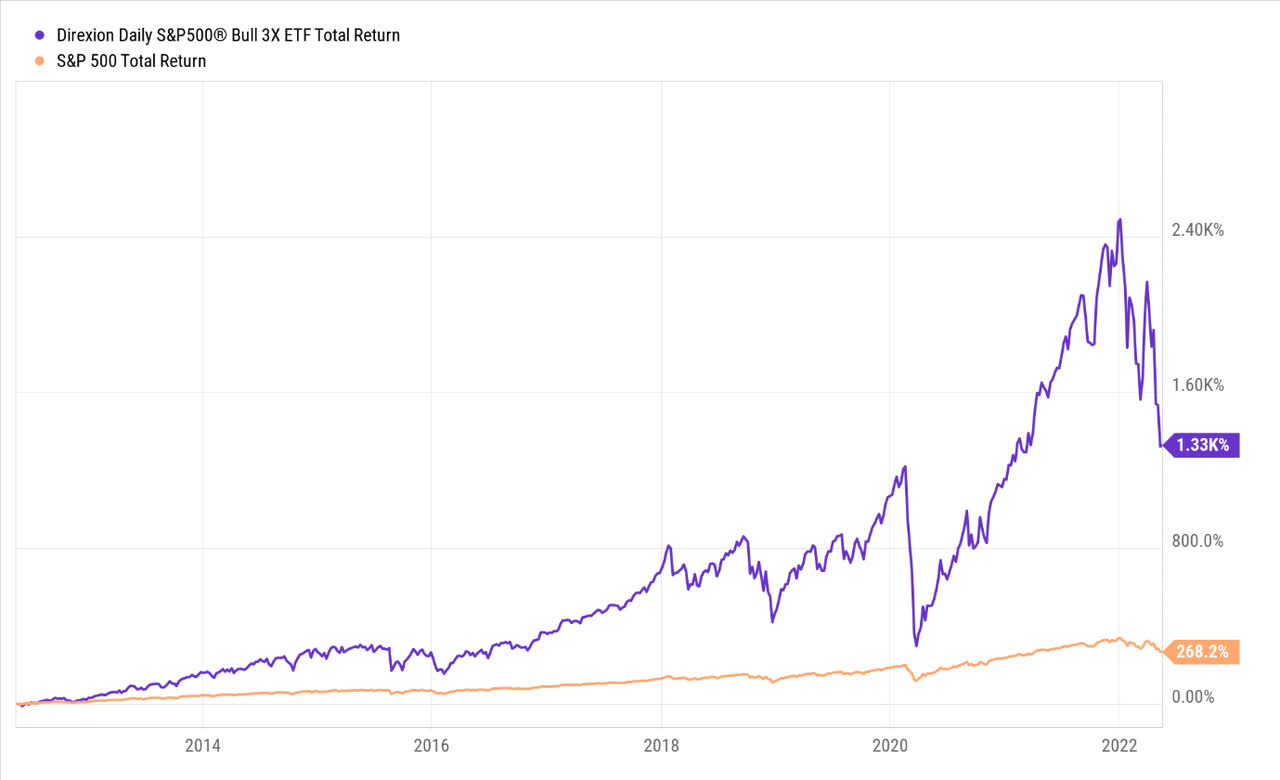
Prima facie, if one were to view the long-term return profile over, say 10 years, SPXL does look like a very tantalizing alpha-generating vehicle, but it’s important for novice market participants not to get carried away by the image below, as there are some tricky nuances to consider.
YCharts
SPXL generally works best during an upward trending environment, and when volatility is not elevated. This is driven by the compounding and daily rebalancing facets of this product, and there are both benefits and risks to this setup. The benefit is that through every day’s price gain, the exposure to the index picks up at an accelerated pace (as they attempt to rebalance daily to ensure 3x daily returns), so one-way trending markets can do a world of good for this product, as cumulative returns ramp up quickly.
Having said that, the higher you go, the more susceptible you are, to brutal drawdowns when the trend reverses course, given the increased exposure you’ve accumulated over time (we know that markets will always pull back, and rarely ever make one-way sustained moves over a prolonged period). So basically, the dollar loss you could potentially suffer at higher levels would be a lot more pronounced than what you would have suffered at lower levels.
Regardless, this levered set-up calls for an acute level of dexterity and market-timing prowess that makes SPXL better suited for those who have a much shorter time horizon than your archetypal buy-and-hold investor. Clearly, you’d also have to be very hands-on with the goings-on in the markets, as even a wee bit of slack, or downtime over a couple of days can quickly decimate your capital if things go against you. Even though this has never happened before, it’s worth bearing in mind that a 33% drawdown in the S&P 500 in just one day can obliterate your entire principal value in SPXL (the worst single-day percentage loss for the S&P 500 so far, was around ~20% in 19-Oct-1987). Regardless, if you feel you have the requisite wherewithal and the risk appetite to hold this product for long periods, I still feel it would be prudent to regularly cash in on your gains as the index moves in your favor, to reduce overall exposure risk at higher levels.
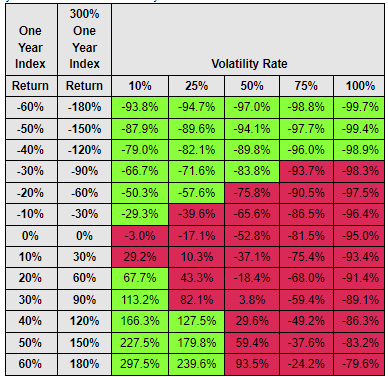
It also isn’t just enough to get the direction right; prospective investors should also be aware of the deleterious impact of volatility on the end returns of this product. Such is the impact of heightened volatility that you could have a scenario where the S&P 500 goes nowhere in a year’s time and you could still end up losing money on this product.
Consider looking at the image below; if the S&P 500 delivers no returns over one year, SPXL could still end up delivering losses of -3% when the index’s annualized volatility range is within 10%. In fact, historically, over the last five years, the S&P500’s annualized volatility rate has been a lot higher closer to ~19%; well, if we were to see something of a repeat of this in the foreseeable future with flat returns for the S&P 500, you’re actually looking at end-returns of over double digits for SPXL based on the table below (a 25% volatility rate with 0% returns on the S&P 500 could result in negative returns of -17% for SPXL).
Direxion
Besides the above-mentioned factors, also consider that SPXL utilizes a range of derivative instruments including futures, swaps, etc. which can bump up the cost profile of this product; basically, a magnified leverage effect also calls for a higher overall expense ratio; this works out to 0.97% for SPXL, around 34bps higher than the corresponding expense ratio of the Daily 2x levered S&P 500 ETF (SPUU). Your standard ETF costs a lot less at <0.05%. The likes of SPXL and SPUU can be very useful and flexible instruments for those interested in making tactical or short-term trading bets, but this steep expense ratio can be quite off-putting.
Closing Thoughts: Current Momentum And Outlook On SPXL
As per Seeking Alpha’s momentum grades, SPXL is in a bad way with a current grade of D (only three months ago, it had a solid A grade, which shows you how quickly things can change).
So, what lies ahead? Well, think about the ideal conditions for SPXL to flourish; you basically need bullish trending conditions, and you need to see lower levels of volatility. Are we likely to see this in the near future? I don’t think so.
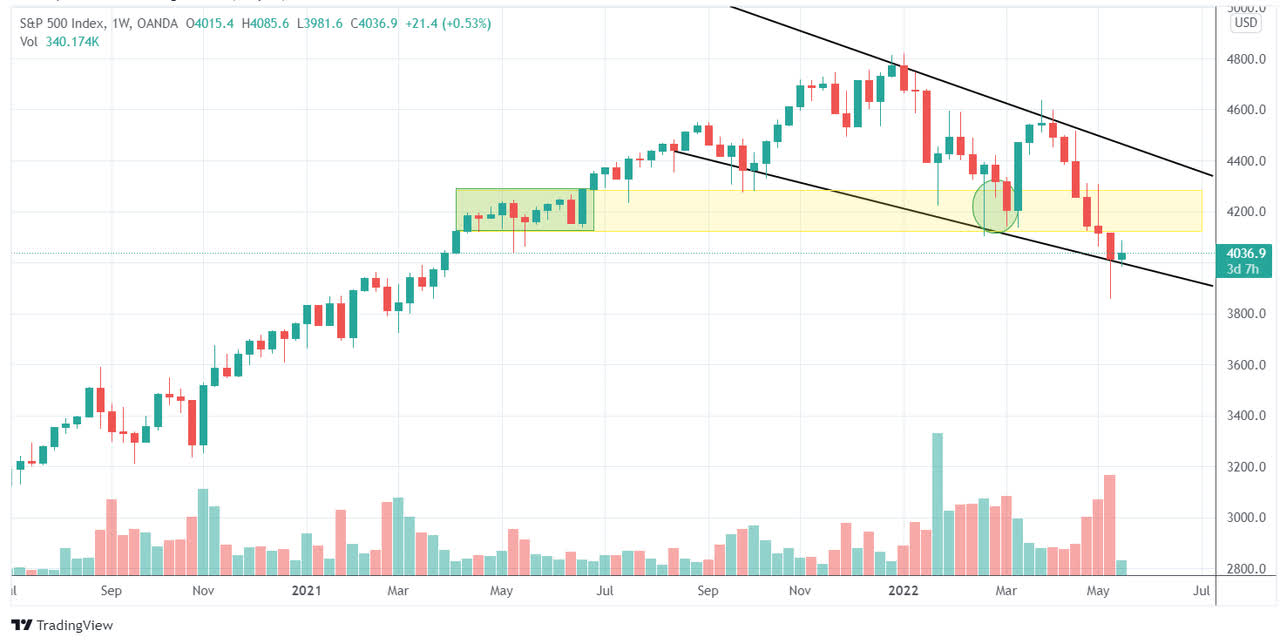
Perhaps one could make a case for the ferocity of selling to ease at current levels. If I pull up the weekly S&P 500 chart, one can see that it is currently perched near the descending channel lower boundary, which you’d hope could offer some support. But even if one were to witness a rally, I think it would be unwise to expect a straightforward V-shaped recovery, all the way to the upper boundary of the descending channel at around the $4400 levels. I believe the best-case scenario is a slight pullback to the congestion zone witnessed in Q2-21 and in Feb/Mar-2022 (green highlighted areas). You may not necessarily even see a pullback to that zone, seeing as the price had just previously sailed through that terrain in late April/early March, but either way, it’s just difficult to see a return of bullish trending conditions.
Trading View
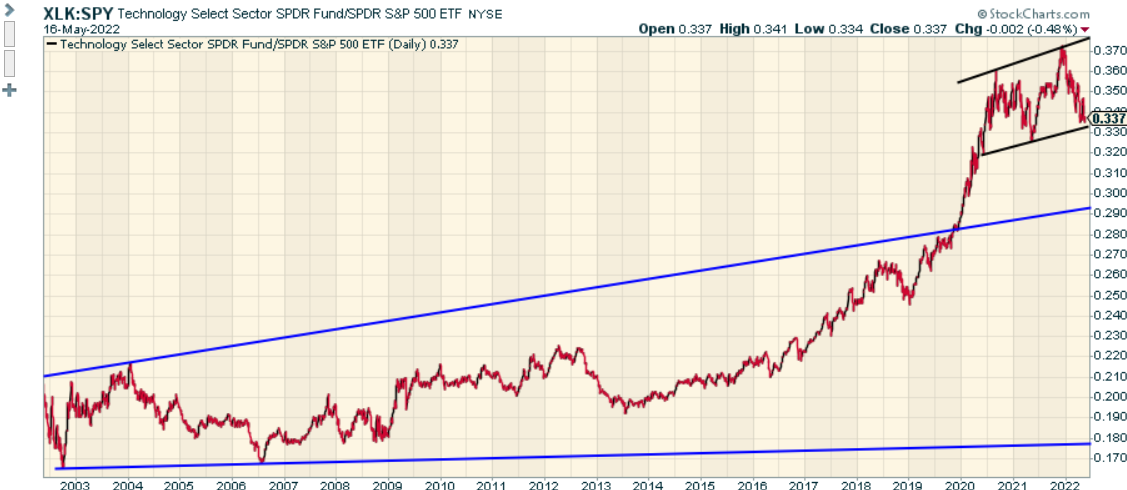
I don’t believe you can make a case for volatility easing either, as a lot of things are currently up in the air. If the S&P 500 is to do well, you’re going to need the high-growth tech sector to start seeing renewed investor interest (tech stocks account for the largest stake in the S&P at 25%). Now if I pull up a relative strength chart measuring the performance of tech stocks belonging to the S&P 500, we can see that this ratio still looks rather elevated versus its long-term range of 0.18-0.29. Having said that, folks with a glass-hall full viewpoint will also point to some near-term support around the lower boundary of the intermediate ascending channel that has been in place since 2020 (the black lines).
Stockcharts
It’s a difficult one to call, but unless one gets some definitive clarity on the rate hike trajectory of the Fed, I feel investors may continue to be very picky with the tech sector. Two separate hikes of 50bps look all but certain over the next two monthly Fed meetings, but despite what many think, I don’t believe you can disregard the prospect of a 75bps hike further down the line; it would be too soon to believe that inflation has likely peaked as we’ve only recently seen the baton shift from the goods side of the equation to the services side (core services inflation was up recently up by 5%, the highest reading in nearly 32 years!). Think about pockets like rents and airfares which could continue to keep inflation hot. All in all, I think one is still staring at a rather ambiguous outlook for inflation and financing conditions, and this will likely only support elevated volatility conditions, which as we know, will continue to disturb levered ETFs such as SPXL.