
[ad_1]
Bet_Noire/iStock via Getty Images
Food is going to get even more expensive. Input costs are quickly rising with forecasts of food shortages. The War in Ukraine has slammed the brakes on supply chains and, worse yet, reduced global food production capacity. Prices of major commodities like wheat, corn, and soybeans have shockingly increased in 2022 but I’m afraid they have not peaked yet. It’s time to hedge against food inflation and I’m doing that by buying the ELEMENTS Linked to the Rogers International Commodity Index (NYSEARCA:RJA).
Inflation
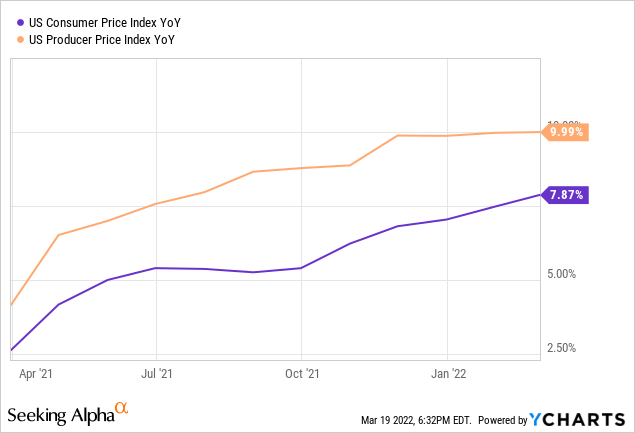
Inflation has been relentless in 2022 with the CPI reaching 7.8% and the PPI nearly reaching 10% in March. The persistent inflation is partially due to elevated energy prices as a result of the war in Ukraine. However, the war has also impacted the cost of the food commodities.
The aggregated price of wheat, corn, soybean, and rice futures has risen by 28% since the start of the year. According to the World Atlas, corn accounts for 19.5% of global caloric intake, rice accounts for 16.5%, and wheat accounts for 15%.
The aggregate price of wheat, corn, soybean, and rice futures (Source: Charts by TradingView (https://www.tradingview.com/x/py140Vr5/))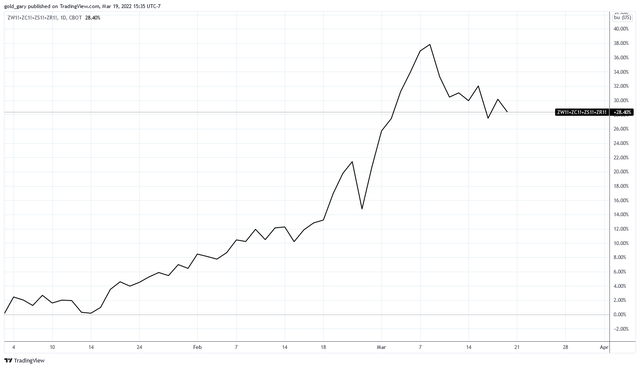
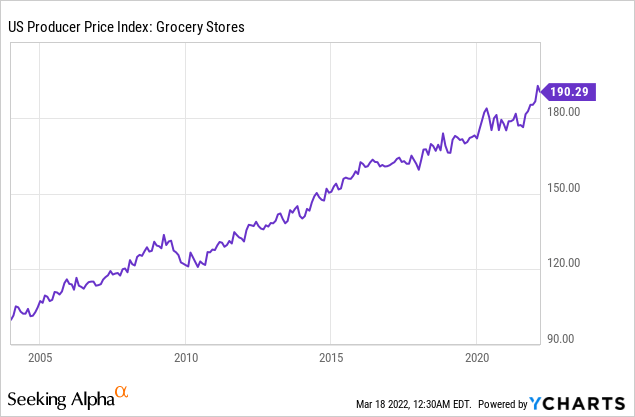
The U.S. Producer Price Index for grocery stores has been steadily climbing with a significant surge since the start of the year. These are increased costs that will be passed on to consumers.
According to the United Nations, 16 countries depend on Ukraine and Russia for over 50% of their wheat imports. Approximately 24% of global wheat imports come from the two countries. More than 20% of global fertilizer imports come from Russia, Ukraine, and Belarus (which is currently sanctioned from exporting).
Source: The Daily Shot (used with permission)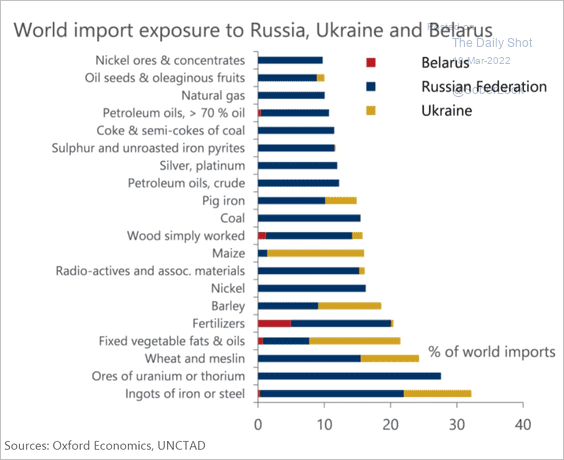
Rising Input Costs
I have seen numerous reports from U.S. farmers that operating costs in 2022 are dramatically higher than 2021. Many are reporting 100-300% increases for some input costs. The inputs suffering the most is fertilizer, fuel, and chemicals. Together, fuel, machinery, chemicals (including pesticides and fertilizer), and seed constitutes approximately 58-62% of total operating costs for row crops like corn.
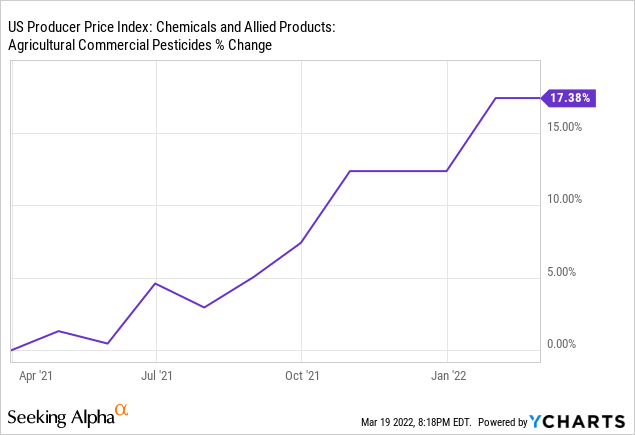
Pesticides
The cost of commonly used pesticides, especially herbicides which are used to the greatest degree, has risen higher. Herbicides are costing 2-5x more than they did last year. And that’s if the product can be sourced, shortages are widespread and most dealers can only acquire a fraction of what they typically sell. Farmers are now making decisions about cutting back. Reports of increased tillage use, in lieu of herbicide, has become commonplace.
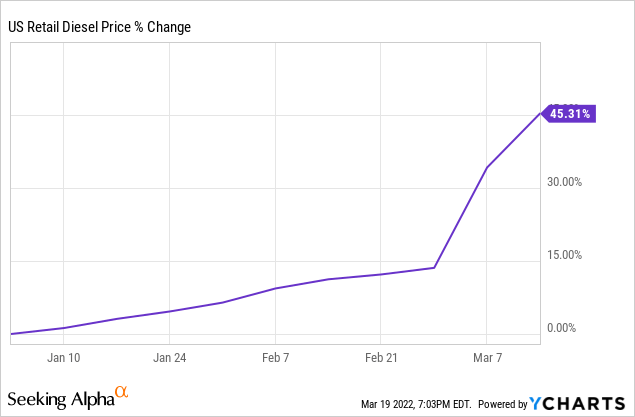
Fuel
Diesel is the primary fuel used for crop production. Year to date the retail cost of diesel is up 45.3%. Plus, costs of oils, lubricants, and other fuels required for farming is reportedly much higher.
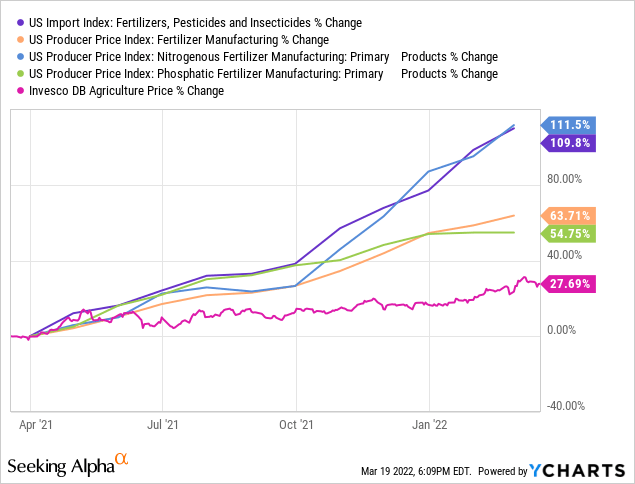
Fertilizer
Data from the Green Markets Weekly North America Fertilizer Price Index shows that fertilizer prices in North America have risen 53.7% since January. The PPI for nitrogen and phosphate fertilizer manufacturing have increased 111% and 54.7% over the last year.
Natural gas is a primary input for the production of fertilizers, especially nitrogen fertilizer which is required to the largest degree and highest frequency for crop production. The price of natural gas in the U.K. is up over 450% in the last 12 months and 96% in the U.S. This is after a brief but violent spike in the price which caused many nitrogen fertilizer plants to shut down during their busiest time of year.
Cost of Natural Gas in U.K. and U.S. (Source: Charts by TradingView (https://www.tradingview.com/x/qBRsa8oD/))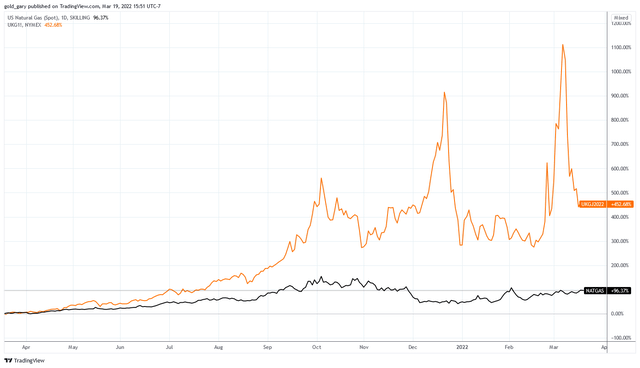
These were reasons why I was so bullish on fertilizer stocks like the Mosaic Company (MOS). In fact, it has been my best call on SA this year. Since I last wrote about it in February the stock is up 40%.
Equipment
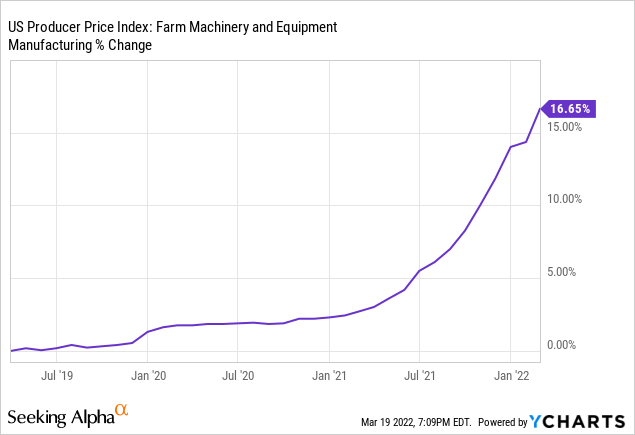
The rising cost of farm machinery has less of an effect on this year’s crop prices because only a fraction of machinery is repaired or replaced each year. The majority of farm equipment that will be used in this year’s production has already been purchased. However, for machinery that does need to be replaced the cost has risen by 13% in the last year.
Export Bans
This article from Wired.com summed up the situation accurately:
Russia and Ukraine are Europe’s breadbasket; the International Food Policy Research Institute estimates that their exports represent 12 percent of all the food calories traded in the world. The two countries account for almost 30 percent of global wheat exports, almost 20 percent of corn exports, and more than 80 percent of the world supply of sunflower oil. Those exports are stalled for different reasons—in Ukraine by Russia’s invasion, and in Russia by global sanctions—but the net effect is the same. It’s as if Iowa and Illinois, the heart of US grain production, were ripped off the map.
Russia is the #3 producer of wheat worldwide and Ukraine is #7. Together, the two countries accounted for one third of wheat and barley exports worldwide. Ukraine has now banned the export of wheat and other crop commodities to protect its domestic markets. Russia has engaged export bans on fertilizers and crop commodities to numerous countries.
China already banned exports of phosphate fertilizers before the war. The ban is in effect until June and the condition of global markets makes it difficult to expect the ban to end on schedule. To top it off, China is expecting a poor wheat crop this year.
And now, the world’s top soybean exporter, Argentina, has halted exports of soybean commodities after reporting poor growing conditions. This global crisis in the making has been recognized by countries worldwide resulting in a series of export bans in countries like Indonesia, Hungary, Serbia, and Egypt. I think this is the beginning and more will follow.
Production Losses
Unfortunately, the highest farm producing areas of Ukraine are in the active fighting areas of the country. The most productive lands are around the capital of Kiev, concentrated towards the east and west. The east region is in the middle of the armed conflicts, while the west region is relatively sheltered from current conflicts.
Winter wheat has already been planted in the country. Corn planting season in Ukraine is in April but spring wheat planting season is now. The issue is that much of the farmland is not safe to access for planting. Farmers cannot access fields for fear of artillery, mortars, or mines along roads.
Supplies of seed and fertilizer is short as logistics systems have broken down across the country. Key infrastructure has been destroyed including roads, bridges, ports, and crop storage facilities.
Wheat harvest will begin in July and corn harvest in September. In addition to infrastructure that won’t be repaired by then, fuel and labor shortages will limit farmer’s ability to harvest. The U.N. FAO estimates that 20-30% of crop acreage will either go unplanted or unharvested in 2022. Research firm SovEcon is forecasting a 19% decline in wheat production and 34% decline in corn production in Ukraine compared to 2021. Grain exports from Ukraine peak August-October each year, corresponding with harvest seasons.
RJA Fund
The United Nations now has upside targets of global food prices that are 7-22% higher than current prices for 2022. I believe we are going to experience a lag effect in crop commodity supplies and thus price. Global commodity markets are designed to manage inventories between crop harvests. Therefore, markets are expecting the bulk of exports from Ukraine in August-October. Markets have begun to price in the impacts to global food inventories but the impact will be in full force when harvest season approaches and inventories run short. That is when I expect fireworks in crop commodity markets, a mere 5 months away.
To gain exposure to crop commodities I prefer the ELEMENTS Linked to the Rogers International Commodity Index (RJA) fund. The fund has exposure to food commodities through futures contract. Therefore, it does not have exposure to operating costs.
Below is a table that compares the holdings of RJA to another agricultural commodity fund the Invesco DB Agriculture ETF (DBA). The table is a consolidated list of the funds’ exposure to agricultural commodities with the largest positions at the top:
| DBA | RJA |
| Wheat | Wheat |
| Soybeans | Corn |
| Corn | Cotton |
| Live cattle | Soybeans |
| Sugar | Coffee |
| Coffee | Live cattle |
| Cocoa | Soybean oil |
| Lean hogs | Cocoa |
| Feeder cattle | Lean hogs |
| Cotton | Lumber |
| Rapeseed | |
| Rubber | |
| Sugar | |
| Rice | |
| Soybean meal | |
| Orange juice | |
| Oats | |
| Milk |
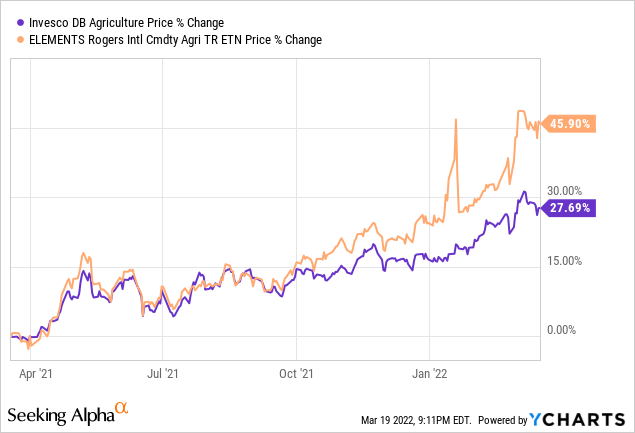
RJA is more diversified than DBA and has been performing better since 2020. For these reasons I prefer RJA for unleveraged long positions.
Due to my confidence in the trade I have considered options on the funds with expiration dates past July. I use a formula to compare options based on breakeven margin and leverage. Of the following options I am most attracted to the Sept 16, 2022 $8 strike call contract on RJA and Jan 20, 2023 $18 strike price call contract on DBA.
Table by author (Data from TD Ameritrade)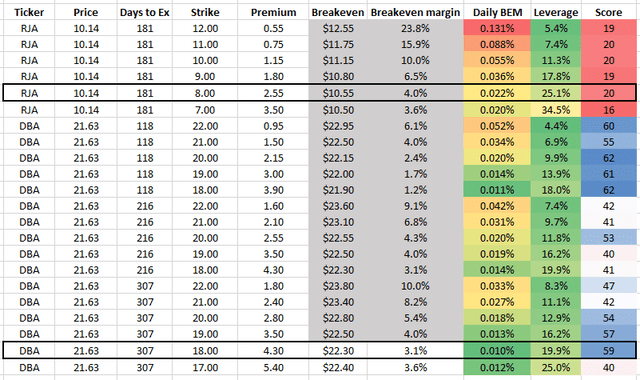
Summary
President Macron of France stated that this situation could lead to a global food crisis. I think he’s right. Farmers are cutting corners to stay solvent which will reduce overall yields and compound shortages that will start in Ukraine and spread to countries and sectors around the world. The global food supply chain is intimately interconnected. The loss of any food source creates a void that must be filled with either a substitute food source or higher prices. It appears certain that the year will end with higher food prices than it began. This is a trade I enter with anxiety. Nothing good comes from higher food prices. I hope I’m wrong.
[ad_2]
Source links Google News