
mrgao/iStock via Getty Images
This ETF review series aims at evaluating products regarding their strategies, portfolios and past performances. As holdings and weights change over time, updated reviews are posted when necessary.
SMDV strategy and portfolio
The ProShares Russell 2000 Dividend Growers ETF (BATS:SMDV) has been tracking the Russell 2000 Dividend Growth Index since 02/03/2015. It has 99 holdings, a distribution yield of 2.82%, and a total expense ratio of 0.40%. Dividends are paid quarterly.
As described in the prospectus by ProShares, the fund invests in
“companies that are currently members of the Russell 2000 Index, have increased dividend payments each year for at least 10 consecutive years and meet certain market capitalization and liquidity requirements.“
Constituents are in equal weight, with a maximum of 30% in any sector. The underlying index is reconstituted annually in June and rebalanced quarterly.
SMDV invests exclusively in U.S.-based companies, 68% in small caps and 32% in micro-cap companies. SMDV is more expensive than the parent index Russell 2000 (IWM) regarding price/earnings, price/sales and price/cash flow ratios. However, it is a bit cheaper in price/book (see next table).
|
SMDV |
IWM |
|
|
Price/Earnings |
17.81 |
11.55 |
|
Price/Book |
1.82 |
1.97 |
|
Price/Sales |
1.32 |
1.16 |
|
Price/Cash Flow |
13.67 |
9.77 |
The fund is overweight in financials (31.6% of asset value), followed by industrials (21.2%) and utilities (15.8%). Other sectors are below 9% individually and 32% together. Compared to IWM, SMDV over-weights these top 3 sectors, along with consumer staples and materials. It considerably underweights healthcare, technology, consumer discretionary, and ignores energy.
SMDV sectors (chart: author; data: ProShares, iShares)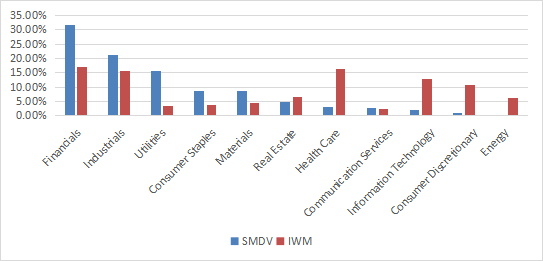
Holdings are in equal weights on rebalancing dates, but they may drift with price action. It explains why financials are beyond the 30% threshold defined by the strategy. The current top 10 names are listed below with fundamental ratios. They represent 11.8% of asset value. The largest holding weighs 1.23%, so risks related to individual stocks are low.
|
Ticker |
Name |
Weight |
EPS growth %TTM |
P/E TTM |
P/E Fwd |
Yield% |
|
PLOW |
Douglas Dynamics, Inc. |
1.23% |
-11.29 |
24.47 |
20.56 |
3.09 |
|
HI |
Hillenbrand, Inc. |
1.20% |
-12.66 |
17.74 |
11.98 |
1.72 |
|
TR |
Tootsie Roll Industries, Inc. |
1.20% |
18.38 |
43.65 |
N/A |
0.81 |
|
BMI |
Badger Meter, Inc. |
1.19% |
16.59 |
51.90 |
51.21 |
0.77 |
|
CNO |
CNO Financial Group, Inc. |
1.19% |
21.32 |
5.78 |
10.03 |
2.47 |
|
AIT |
Applied Industrial Technologies, Inc. |
1.17% |
73.51 |
17.80 |
17.72 |
1.06 |
|
MATW |
Matthews International Corp. |
1.17% |
-3831.20 |
N/A |
10.65 |
2.96 |
|
SJW |
SJW Group |
1.17% |
2.16 |
40.83 |
33.42 |
1.83 |
|
TRN |
Trinity Industries, Inc. |
1.17% |
166.34 |
66.89 |
28.97 |
3.13 |
|
FUL |
H.B. Fuller Co. |
1.15% |
27.05 |
21.51 |
18.25 |
0.99 |
Historical performance
Since inception in February 2015, SMDV beats IWM by 21 percentage points in total return (see next table). Moreover, it shows a significantly lower risk in drawdown and volatility (standard deviation of monthly returns). In 2022, SMDV has outperformed IWM by about 14 percentage points.
SMDV also beats its closest competitor in return and risk metrics, the WisdomTree U.S. SmallCap Quality Dividend Growth Fund (DGRS).
|
Total Return |
Annual Return |
Drawdown |
Sharpe ratio |
Volatility |
|
|
SMDV |
88.64% |
8.45% |
-33.22% |
0.53 |
15.69% |
|
IWM |
67.51% |
6.81% |
-41.47% |
0.37 |
21.04% |
|
DGRS |
73.71% |
7.31% |
-43.97% |
0.39 |
21.42% |
SMDV vs benchmark and competitor since February 2015 (Portfolio123)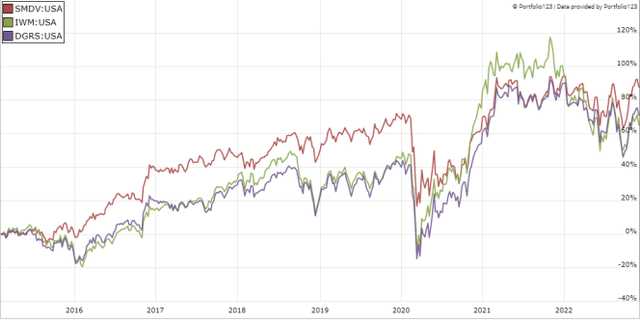
The annual sum of distributions per share was $0.725 in 2016, and $1.364 in 2021, which represents a 87% increase in 5 years. SMDV definitely deserves its dividend growth label.
In previous articles, I have shown how three factors may help cut the risk in a dividend portfolio: Return on Assets, Piotroski F-score, and Altman Z-score.
The next table compares SMDV since inception with a subset of the S&P 500: stocks with above-average dividend yield and ROA, good Altman Z-score and Piotroski F-score, and a sustainable payout ratio. It is rebalanced annually to make it comparable with a passive index.
|
Total Return |
Annual Return |
Drawdown |
Sharpe ratio |
Volatility |
|
|
SMDV |
88.64% |
8.45% |
-33.22% |
0.53 |
15.69% |
|
Dividend quality subset |
119.64% |
10.57% |
-36.33% |
0.64 |
16.51% |
Past performance is not a guarantee of future returns. Data Source: Portfolio123
The dividend quality subset beats SMDV by 2.1 percentage points in annualized total return. However, the fund’s performance is real, and the subset is hypothetical. My core portfolio holds 14 stocks selected in this subset (more info at the end of this post).
Scanning SMDV with quality metrics
SMDV holds 99 stocks. I have scanned them with my quality metrics, considering that risky stocks are companies with at least 2 red flags among: bad Piotroski score, negative ROA, unsustainable payout ratio, bad or dubious Altman Z-score, excluding financials and real estate where these metrics are less relevant. With these assumptions, 16 holdings are risky and they weigh 15.5% of asset value, which is acceptable.
Based on my calculation, SMDV beats its parent index in my preferred quality metrics: Altman Z-score, Piotroski F-score and ROA. The difference in return on assets is noteworthy.
|
Atman Z-score |
Piotroski F-score |
ROA % TTM |
|
|
IWM |
3.01 |
4.13 |
0.89 |
|
SMDV |
3.42 |
4.56 |
3.99 |
Takeaway
SMDV is a small cap dividend growth ETF following an equal-weight methodology. The heaviest sector is financials, with over 30% of asset value. The fund looks less attractive than the parent index Russell 2000 regarding valuation, but quality metrics are better. Risky stocks (excluding financials) represent about 15% of asset value. SMDV beats the Russell 2000 in total return since inception and it is less volatile. It also beats its main competitor DGRS. Moreover, the annual sum of distributions went up by 87% between 2016 and 2021. For transparency, a dividend-oriented part of my equity investments is split between a passive ETF allocation (SMDV is not part of it as of writing) and my actively managed Stability portfolio (14 stocks), disclosed and updated in Quantitative Risk & Value.