
marekuliasz/iStock via Getty Images
Investment Thesis
Last August, I wrote about how the odds of profiting from an investment in the Invesco S&P 500 High Beta ETF (SPHB) significantly improved if investors waited for the S&P 500 to correct more than 8% over two months. Otherwise, it’s too risky and simply not worth it when there are so many other choices in the ETF space. While we’re not at the magic 8% mark yet, we are getting close after a rough January, so I wanted to provide readers with an update on what to expect in the coming weeks.
In this article, I’ll provide a quick review of the simple trading framework based on technicals, along with an analysis of current and expected holdings once the Index reconstitutes on February 21. SPHB isn’t a buy yet, but I think if it falls to around $66 soon, investors will have a solid shot at outperforming the market afterward.
SPHB Overview
Strategy & Fund Basics
SPHB tracks the S&P 500 High Beta Index, which holds the 100 most volatile stocks in the S&P 500 Index over the last twelve months. It’s volatility-weighted, but the weights range from 0.60% to 1.48%, so it might be easier to think of SPHB as an equal-weight ETF. In my view, the high beta concept is similar to leverage, whereas your returns can be substantial, but so can your losses. Therefore, it’s important to choose your entry points wisely. Before we look at SPHB’s composition, here are some of the fund’s basic statistics below:
- Current Price: $72.23
- Assets Under Management: $566 million
- Expense Ratio: 0.25%
- Launch Date: May 5, 2011
- Trailing Dividend Yield: 1.00%
- Five-Year Dividend CAGR: 16.20%
- Two-Year Beta: 1.34
- Five-Year Beta: 1.34
- Number of Securities: 100
- Portfolio Turnover: 113%
- Assets in Top Ten: 13.97%
- 30-Day Median Bid-Ask Spread: 0.04%
- Tracked Index: S&P 500 High Beta Index
As shown, it’s not an especially large fund with just $566 in assets under management, but it is an active one if the 113% portfolio turnover rate is any indication. Frequent quarterly reconstitutions and a generally volatile market will cause this for any rules-based ETF. Two- and five-year betas are 1.34. And finally, the expense ratio of 0.25% may be a little high compared to Index funds like the iShares Core S&P 500 ETF (IVV), but it’s still relatively low such that fees won’t have much of an impact. Since I recommend this as a trading vehicle rather than a long-term holding, these fees should end up being negligible.
Sector Exposures & Top Holdings
Currently, Technology stocks make up 35.67% of the ETF, followed by Consumer Discretionary and Energy with 16.69% and 15.09%, respectively. Financials also have solid representation with a 13.70% allocation, but there are almost no defensive stocks in the ETF. It may be obvious, but I’m emphasizing this so that investors won’t attempt to use it as an S&P 500 alternative.
SPHB Fund Overview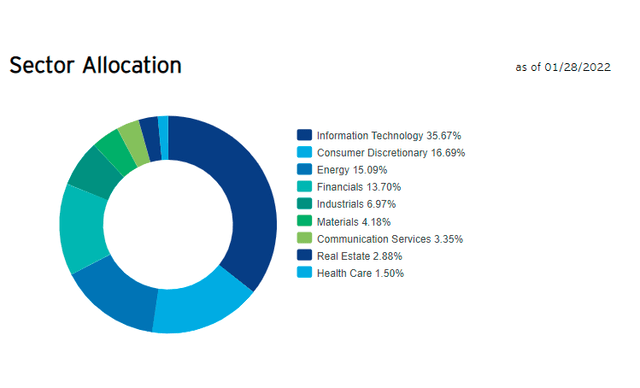
SPHB’s top ten holdings total just 13.98%. Due to higher oil prices, six of the top ten are Energy stocks, while four semiconductor stocks complete the list.
SPHB Fund Overview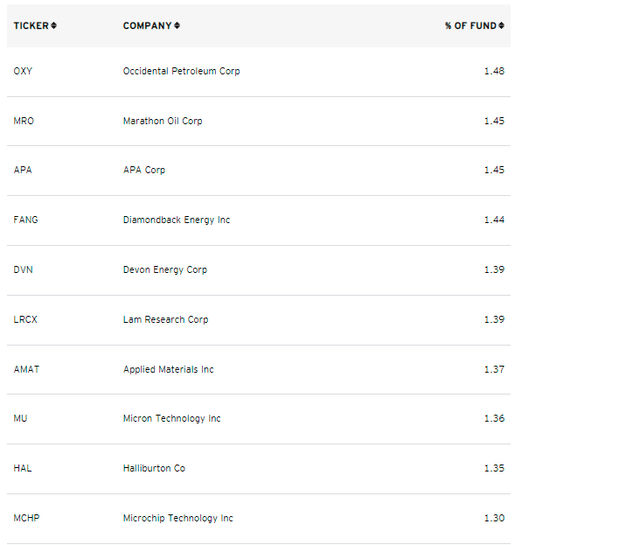
Historical Performance
SPHB has been an underperformer over the last decade or so, both on risk and return. Compared with IVV, it’s missed by 1.88% per year. It’s also trailed the iShares S&P 500 Growth ETF (IVW) by 3.95% per year.
Portfolio Visualizer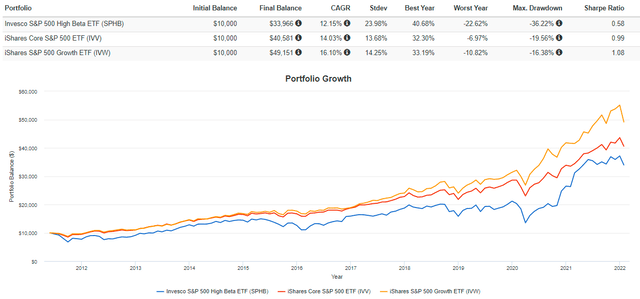
Applying The Strategy
Price Technicals
Given these results, I think it’s reasonable to question the merits of the high beta strategy. Still, hidden inside the graph below are pockets of outperformance that have some commonalities. Specifically, when the S&P 500 falls more than 8% on a rolling two-month basis, SPHB consistently outperformed the next month. Admittedly, it hasn’t happened often in a lengthy bull market, but the strategy is intuitive. If market corrections aren’t slow and painful, high beta stocks are likely to fall the fastest but then bounce back the quickest.
Since December, IVV has fallen 2.72% but was down as much as 5.05% on Thursday before staging a comeback on Friday. Earnings season is underway, and the Cboe Volatility Index (VIX) has risen by 60.63% in the last month. It’s not hard to imagine another 4-5% fall this week, especially with Alphabet (GOOGL, GOOG), Amazon (AMZN), Meta Platforms (FB), and Exxon Mobil (XOM) set to report.
Industry Fundamentals
I’m not a technical trader, as I believe fundamentals drive stock returns and not the other way around. Therefore, I always check an ETF’s fundamentals before rating it. With SPHB’s top holdings not revealing much based on their small weights, an analysis by industry is more appropriate. Below are some statistics I’ve calculated, applicable for about three weeks.
Created By Author Using Data From Seeking Alpha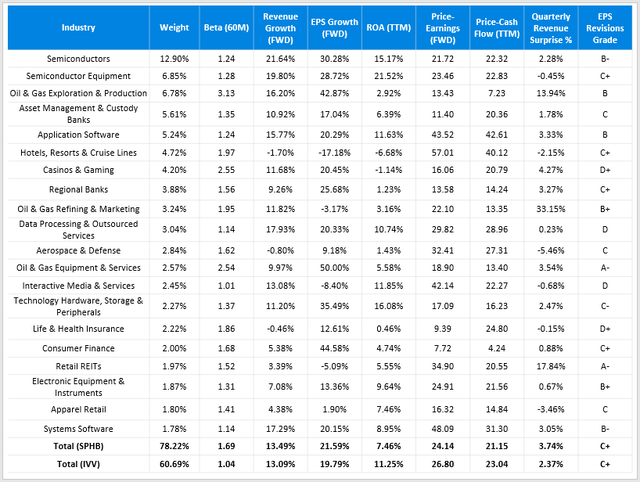
As shown, SPHB has a combined 19.75% exposure to semiconductors and semiconductor equipment stocks, alongside healthy allocations to oil and gas stocks that should provide an excellent hedge against inflation. However, I am concerned with the allocations to travel-related stocks like Norwegian Cruise Line Holdings (NCLH) and Royal Caribbean Cruises (RCL). I would also include Casinos & Gaming stocks like Penn National Gaming (PENN) and Wynn Resorts (WYNN) in this speculative category. I see enough uncertainty suggesting investors should be pretty greedy before taking a position.
However, the overall fundamentals look solid. Expected revenue and earnings per share growth are a little better than IVV’s, and it’s trading at a slight discount on both forward earnings and trailing cash flow. The discount seems warranted based on its lower return on assets, but what stands out is the five-year beta of 1.69. Recall the fund’s five-year beta was only 1.34, meaning the current holdings are even more volatile than usual. I’m certainly skeptical about holding it through such a crucial earnings season.
Projected Look: February 21 Onwards
SPHD reconstitutes quarterly, so beginning the week of February 21, we will get a new set of holdings to analyze. I’ve run the calculations using January 28 prices and expect 38 holdings to be exchanged, with Moderna (MRNA), SolarEdge Technologies (SEDG), ViacomCBS (VIAC), Discovery (DISCK), and Biogen (BIIB) becoming prominent holdings. With such considerable change, investors should be prepared, so I calculated the same metrics for the projected fund. Broadly, I’m expecting Communication Services, Consumer Discretionary, and Health Care exposures to increase by 6%, while Financials and Technology will decrease by 8%. More details are provided below at the industry level.
Created By Author Using Data From Seeking Alpha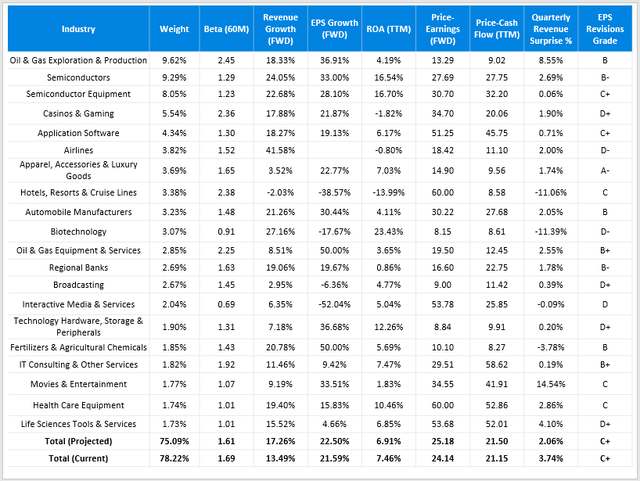
As shown, it appears that SPHB’s holdings will become less profitable and more expensive, as indicated by the ROA and the two price ratios. Moreover, the most recent quarterly revenue surprise figure is worse. While these metrics will change as earnings reports come in, I see it decreasing in quality in three weeks.
Investment Recommendation
Investors willing and able to take on excessive risk should look to buy SPHD only if the S&P 500 falls by about 5% after some big names report this week. Given how SPHB’s current beta is 1.69, that should result in a price drop of about 8.45% and a price target of around $66. This decline is substantial but is necessary to make the risk-reward proposition attractive.
Also, remember that SPHB will reconstitute effective February 21, and absent any significant positive earnings surprises in the interim, I’m projecting the fund’s quality will decline. It’s not a good long-term fund, but if you’re already a holder or are interested in taking out a position soon, I hope you found this information helpful.