")
Investment Thesis
The iShares Core U.S. REIT ETF (USRT) is a low-cost, high-yielding, best-of-class fund for long-term investors in the U.S. real estate. Despite having a smaller net asset size than similar funds, it has one of the highest dividend yields and the lowest expense ratio among REIT ETFs.
Fund Information
USRT is a diversified ETF established on May 01, 2007, that tracks an index of U.S. REITs. Per the fund’s website, USRT “seeks income and growth with broad exposure to U.S. real estate across property sectors.” Reported net assets as of 04/30/2019 totaled $1.287 billion. The fund’s most current expense ratio, consisting solely of a management fee, is 0.08%.
Distributions
The fund pays dividends quarterly and has done so consistently over the past two years, as shown below:
Based on the most recent four quarters’ dividends (totaling $2.51) and the ETF closing price as of 04/30/2019 ($51.59), the current distribution yield is 4.86%. All of these distributions come from income and none of them are classified as return of capital.
As you can see, the October 2018 distribution was significantly larger than the fund’s standard quarterly payment. To determine a normal, average distribution yield, I took the average of the other three most recent dividend payments (March 2019, and December and July 2018, totaling $0.411413 per share) and multiplied the result by four. This calculation indicates that without the large December distribution, the average distribution yield for USRT is about 3.19%.
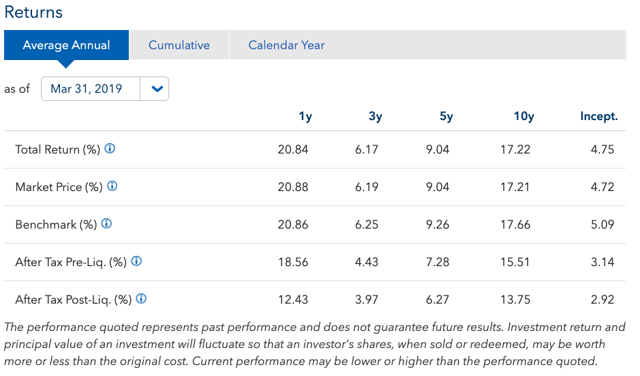
Performance
Based on the chart below, USRT consistently tracks its index and has delivered stable returns since its inception:
Fund Comparison
In my own passively-managed investment portfolio (modeled after the Yale University endowment), I prefer large index funds with low expense ratios. For this reason, before I delve into a fund’s financial statements, I always compare the fund in question to its peers using the metrics that I have already discussed: Net assets, distribution yield, holdings, and expense ratio. (Note: Performance is not a concern at this point because I am focused on the asset class; index funds track an index, so comparing the performance of index funds is not very productive.)
These four criteria alone give me a strong indicator of which particular fund that I should researcher more in-depth. A simple comparison chart of several U.S. real estate ETFs are presented below:
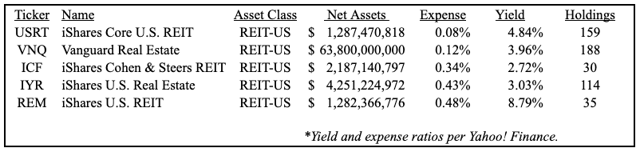
As you can see, USRT is not the largest fund in the group (that honor goes to VNQ, Vanguard Real Estate) nor the highest yielding (which falls to REM, iShares U.S. REIT, and its incredible 8.79% yield). However, USRT has net assets similar to the other funds, the second largest amount of holdings (directly behind VNQ), the largest yield (when excluding REM’s outlying figure), and most importantly: the lowest expense ratio at 0.08%! This is primarily why I chose USRT for my own investment portfolio.
Now, with that fund comparison out of the way, we proceed to the most comprehensive section of the analysis: the financial statements.
Financial Statement Analysis
The last, and in my opinion, the most important part of analyzing an investment is to read the financial statements. USRT’s most recent report is its semi-annual report dated October 31, 2018. If you are planning on purchasing USRT or currently hold it, I would also read the most current annual report, which gives you a more complete snapshot of an equity’s financial picture. The major sections of USRT’s semi-annual report are discussed below.
Fund Summary (p. 6)
The data here mostly correspond to what is found on the website. The performance figures, expense ratio, and holdings are all similar to the information on the fund’s website.
Schedule of Investments (pp. 13-16)
The fund’s website reports 159 total holdings as of 04/29/2019. Per the fund’s website, the top 3 holdings include Simon Property Group REIT Inc. (SPG), ProLogis REIT Inc. (PLD), and Equinix REIT Inc. (EQIX). As stated in the fund’s introduction, USRT is well-diversified across a variety of REIT sectors:
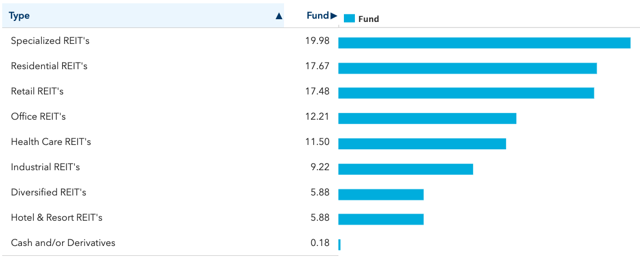
The holdings schedule in the financial statements reflects similar holdings. With only two exceptions, all portfolio holdings are in a REIT sector. Additionally, USRT has positions in two separate Blackrock cash funds (typical of most ETFs), as well as a small, long futures contract (nominal value $2,131) on the Dow Jones U.S. Real Estate index.
Statement of Assets and Liabilities (p. 27)
USRT reports total assets of $809.9 million. Liabilities total a comparatively minuscule $82 million, of which $80.3 million constitute collateral on securities loaned out. Subtracting liabilities from total assets results in net assets of $728 million, which is about $500 million less than the most recent net assets figure on the fund’s website; an encouraging sign of growth!
Statement of Operations (p. 29)
USRT reports investment income totaling $22 million, most of this dividend income. After subtracting a modest advisory fee of $273,934, net investment income is $21.9 million. Based on these figures, USRT keeps about $0.99 of every investment dollar that it receives, making it a very efficient index fund!
Despite these incredible results, the schedule directly below it, “Realized and Unrealized Gain (Loss),” can sometimes damper my investing enthusiasm. However, USRT is lucky that on a net basis, appreciation in the value of the fund’s investments contributed about $5 million to net assets, resulting in an increase in net assets from operations of $25.5 million.
Statement of Changes in Net Assets (p. 31)
This statement is important because it describes the sources of cash and may indicate cash flow problems. While the fund did slightly over-distribute its net assets resulting from operations by $722,762 (net increase from operations of about $25.5 million less $26.2 million distributed to shareholders), it also experienced a net increase of $214 million from capital share purchases. Because of this overdistribution, the next section of the report (which tracks changes in the fund’s NAV) will tell the true story of how the fund is operating.
Financial Highlights (p. 35)
Beginning with a NAV of $45.04 on May 1, 2013, USRT’s NAV has increased to $46.97 as of October 31, 2018 (a modest increase of about 4.3% over this time period). A quick scan of the net increase from investment operations and total distributions lines show that in all periods except the years ended 2014 and 2018, distributions were fully covered by that year’s increases in net assets. This is an encouraging set of data that relieves my suspicions of the overdistributed funds mentioned in the previous section. While USRT’s NAV has done some jumping around over this time period (from a low of $42.38 in 2014 to a high of $48.93 in 2017), it is gradually increasing.
Notes to the Financial Statements (p. 39)
Finally, I scanned the notes to determine if there were any other substantial disclosures that might affect an investment decision. The only two that I found (both previously discussed in this analysis) were about USRT’s securities lending activities (Note 4) and its usage of derivatives (futures contracts, in Note 5).
Summary
As demonstrated in this analysis, USRT is a best-in-class fund for long-term investors seeking exposure to U.S. real estate. The fund’s low expense ratio and high dividend yield make it a must-buy for real estate investors.
Disclosure: I am/we are long USRT. I wrote this article myself, and it expresses my own opinions. I am not receiving compensation for it (other than from Seeking Alpha). I have no business relationship with any company whose stock is mentioned in this article.