")
Pavel Muravev
Thesis
As detailed in our earlier article:
We use a top-down investment approach. We use a market dashboard to take a 30,000 feet view first. We then decide where to look further – which sector, growth stocks, value stocks, bonds, or precious metals, et al.
With this approach, this article provides a market outlook for the remainder of the year. And the thesis is that the industrial sector, represented by Industrial Select Sector SPDR ETF (NYSEARCA:XLI), is a sector to avoid in general. After looking at the forest via the exchange-traded fund (“ETF”), we will also descend and take a look at some of the trees. In particular, we will examine General Electric Company (NYSE:GE) more closely. And unfortunately, we see major valuation risks and concerns with its business prospects, too. More specifically:
- As you can see from the dashboard below (and you are welcome to download it here), it is the 3rd most expensively valued market sector now. The sector’s valuation premium is actually near a peak level in a decade adjusted for risk-free interest rates as you will see next. The sector’s dividend yield is below its historical average substantially (a yield Z-score of -0.67). And its yield spread relative to the risk-free rates is even more concerning (a yield spread Z-score of -0.85).
- With the sector, we see GE as a stock to avoid too. The stock has been underinvesting in itself for years due to its free cash flow and debt problems. It reported a positive free cash flow in its recent 2022 Q2 report. But the problems have been accumulated over a period of time already, and furthermore, we also see free cash flow under pressure for the 2H of 2022.
- For readers interested in the industrial sectors, we feel more comfortable with other names such as Raytheon Technologies Corp (RTX), Lockheed Martin Corp (LMT), and Caterpillar Inc (CAT). We have written about them recently. And to be clear, we feel they are fully valued too. But we do not see any outsized valuation risks in them, plus we see their financial position and business prospects much brighter.
- Finally, we see the energy sector (XLE) as the most promising sector for 2H of 2022. And we do plan to write a separate article to elaborate on it very soon.
We then will elaborate on the above points immediately below.
Author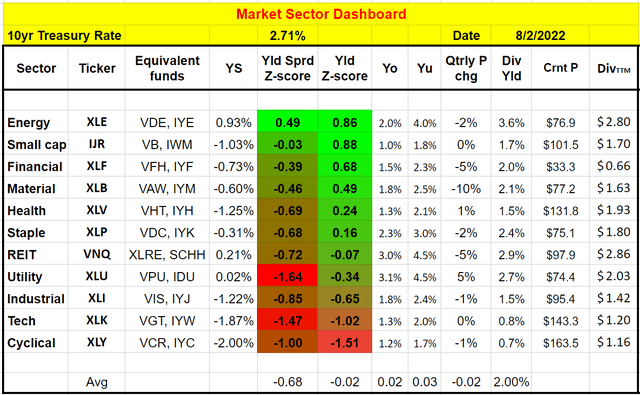
XLI and GE: basic information
XLI is one of the most popular funds for the industrial sector. As of this writing, it holds a total of 75 stocks in the sector as you can see from the following chart. GE is the 10th largest holding, representing 2.8% of the total assets.
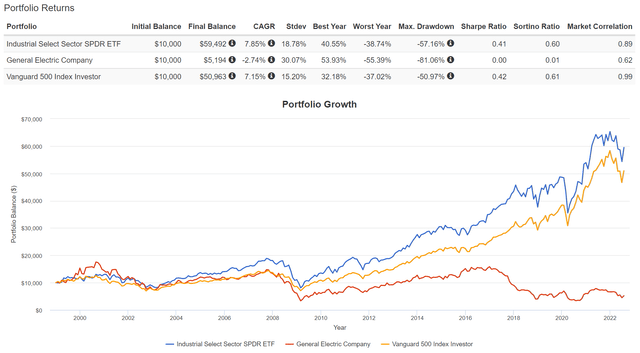
As you can see from the second chart below, XLI has delivered superior performance over the overall market represented by the S&P 500 index. Since the fund’s inception in 2000, XLI has delivered an annual return of 7.85% CAGR, while S&P 500 delivered “only” 7.15%. In contrast, GE was a disaster as you all must know already. It delivered a negative total return during the longest bull run. And next, you will why we think XLI is now grossly overpriced due to its past valuation expansion, and also why we think GE’s underperformance is likely to continue.
Seeking Alpha Portfolio Visualizer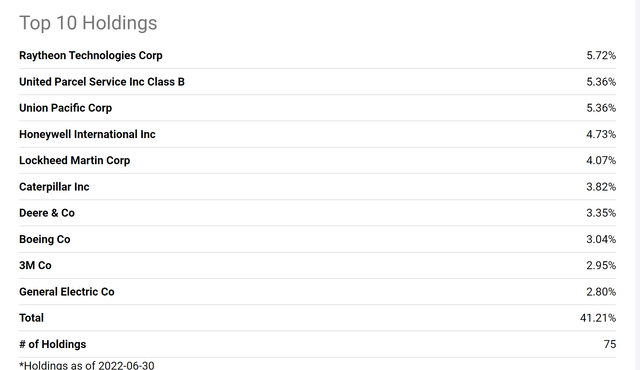
Industrial sector valuation premium
An effective way to evaluate valuation premium is by the dividend yield because dividends provide a reliable measure of owners’ earnings as detailed in our earlier article. XLI is currently yielding 1.42% and 10-year treasury rates are at 2.71%, thus XLI provides a negative yield spread of 1.29% compared to the risk-free interest rates.
The following chart puts the -1.29% yield spread into a historical perspective by showing the yield spread between XLI and the 10-year treasury rates over the past decade. As can be seen, the spread is bounded and tractable most of the time. The spread has been in the range between about 0. 5% and -1.5% the majority of the time. Such a tractable YS suggests that when the spread is near or above 0. 5%, XLI is significantly undervalued. And vice versa.
Now we are seeing a yield spread that is near the lowest level in a decade, signaling a substantial valuation premium.
Author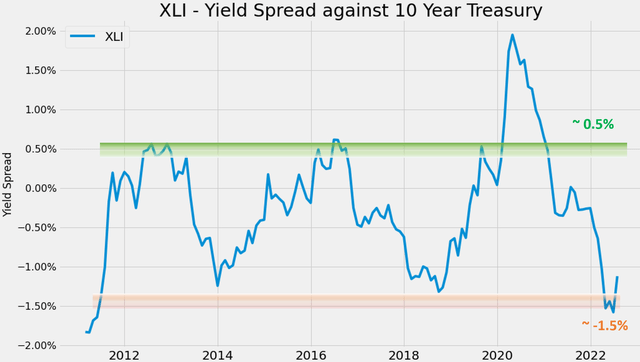
This next chart shows that XLI’s performance is positively correlated with the yield spread. It shows the 1-year total return (including price appreciation and the dividends – both regular and special dividends) from XLI when the purchase was made under different yield spreads. You can see that there is a clear positive trend and the Pearson correlation coefficient is 0.68. Again, the current yield spread of -1.29% is close to the thinnest level of the historical spectrum and has been correlated with poor returns in the past decade.
Author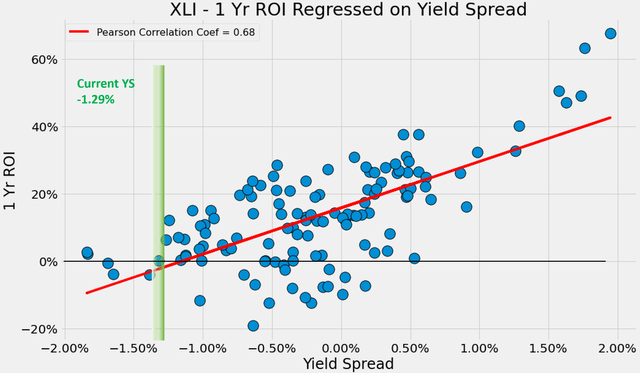
GE’s underinvestment: CAPEX vs depreciation
After evaluating the forest, let’s now descend and examine GE more closely. A rising tide lifts all boats, and GE’s valuation is not cheap either. As a matter of factor, it is even more expensive than other stocks in the sectors (such as CAT and RTX As aforementioned) that offer strong financial strength and more certainty. To cite a few numbers, GE is currently trading at 27.6x FY1 P/E, more than 76% above CAT’s 13.84x and more than 29% above RTX’s 19.8x.
Seeking Alpha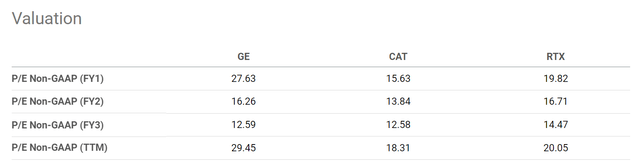
What’s more concerning to us is GE’s capital allocation issues. The business is in such a stretched financial position lately. The following chart provides a summary of its CAPEX spending in the past decade. As you can see, its CAPEX expenditures were above 8% of its total revenues in the earlier part of the decade. Then it steadily declined to the current level of only 1.9% of its total revenues. This decline is not because GE has transformed itself into a capital-light business. It is largely caused by free cash flow issues and a large debt burden.
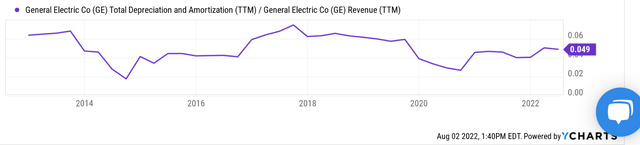
To put things under perspective, the second chart shows GE’s depreciation and amortization over the past decade. As you can see, its depreciation/amortization has been more or less stable as a fraction of its total revenue. The long-term average is about 5%. If we use the depreciation/amortization as an approximation for its maintenance CAEPX requirement, then GE has not been spending enough in the past decade to cover its maintenance CAPEX.
Seeking Alpha Seeking Alpha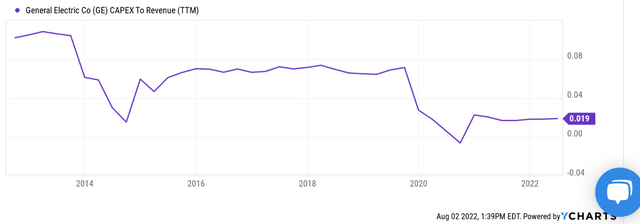
GE’s business outlook
Since its new CEO Larry Culp took over, GE has been engaging in many dramatic restructuring moves (more on this in the next section). Some of these efforts are working, and its long-term debt has been reduced from almost $90B in 2018 to the current level of $27.5B. It has also generated a small positive free cash flow of $200M in the past quarter, mostly driven by this aerospace division. However, there are more headwinds ahead. GE’s CEO Larry Culp commented during the Q2 earnings report (abridged and emphases added by me):
Healthcare is stabilizing but still faces supply chain challenges and renewables remains difficult… Free cash flow was roughly $200 million and improved slightly year-over-year due to better adjusted earnings. This was offset by higher working capital tied to inventory build as we prepare for the second half ramp as well as work through the supply chain issues… Notwithstanding much is still uncertain about the external environment companies like GE are facing at the moment. We continue to trend toward the low end of our 2022 outlook on all metrics except cash.
GE Q2 earnings report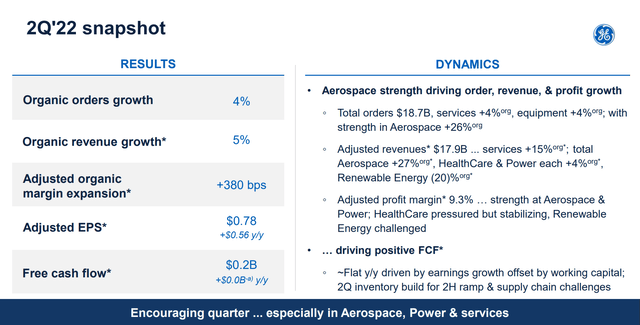
Final thoughts and other risks
In summary, we see the entire industrial sector represented by XLI at a valuation premium near the peak level in a decade. For individual stocks, we see GE as unattractive as well both due to valuation concerns and business fundamentals. We have analyzed most of the top 10 stocks in the sector, and we have a similar concern for Boeing (BA) and 3M Corp (MMM). Out of the top 10 stocks in this sector, we feel more comfortable about RTX, LMT, and CAT ourselves.
Finally, risks. For GE, besides the near-term headwinds mentioned above (inventory, supply chain, et al), I see GE’s problem as more of a fundamental and structural problem accumulated by years of underinvestment. Furthermore, I view its separation plans as another risk. The portfolio will be split into three and the division is not scheduled to begin until early 2023. For such a large-scale and complicated separation, I won’t be surprised to see delays and hiccups. For investors who are more optimistic about a given division (I like its aviation division the most), it is probably a good idea to buy that division only after the sperate is complete.