[ad_1]

R.M. Nunes
The Financial Select Sector SPDR ETF (NYSEARCA:XLF) is made up of financial firms that are part of the S&P 500 and these stocks make up 11.1% of the S&P 500. With the 17.2% price decline for the YTD, XLF has fallen back to a price very close to the pre-COVID 2022 peak. XLF closed at $31.17 on February 13, 2020 and currently trades are $32.09. XLF’s trailing 3-year annualized total return is 7.5% per year vs.10.6% per year for the S&P 500 (SPY).

Seeking Alpha
5-Year price history and basic statistics for XLF above.
Generally speaking, banks tend to perform well during periods of rising interest rates and this is true for XLF. A simple way to measure the response of an ETF or stock to interest rates is to calculate the correlation between the return on the ETF or stock and changes in Treasury bond yields. I have calculated the correlation between the total return on XLF and the percentage change in 10-year Treasury yield over 1, 3, and 6 months for historical periods ranging from 5 years to 20 years (using date through August of 2022). For example, the correlation between the 3-month total return on XLF and the 3-month percentage change in the 10-year Treasury yield is +47% over the past 10 years. The consistent positive correlations show that XLF tends to rise when interest rates and bond yields rise.

Geoff Considine
Correlation between total return on XLF and percentage change in 10-year Treasury yield for rolling 1-, 3-, and 6-month periods over the last 5, 10, 15, and 20 years given above.
So far in 2022, XLF has returned a total of -14.9% vs. -18.2% for the S&P 500. The 10-year Treasury yield has risen substantially over this period, going from 1.7% at the start of the year to 3.6% today. An additional tailwind for XLF is that value stocks have dramatically outpaced growth stocks so far in 2022. The iShares S&P 500 Value ETF (IVE) has returned -10.6% for the YTD vs. -25.1% for the iShares S&P 500 Growth ETF (IVW). XLF has a substantial value tilt (see the 0.55 value factor loading). As such, XLF would be expected to have performed well relative to the total stock market so far in 2022.

Portfolio Visualizer
3-Factor Fama-French loadings using 60 months of history through August of 2022 above
Note: I included the Fama-French factor loadings for the S&P 500 for context. The S&P 500 has a large cap tilt (so a negative weight on the size factor) and is neutral in terms of value vs. growth.
The outperformance of value and the rising bond yields so far in 2022 are related to one another. The valuation of a stock depends on the discount factor applied to future earnings and the discount factor rises with interest rates. The value of a growth stock depends more heavily on earnings that are expected to occur further into the future, so an increase in interest rates lowers the net present value of growth stocks relative to value stocks.
The traditional banking model relies on the ability to borrow short and lend long. When short-term rates rise relative to long-term rates, this cuts into a bank’s ability to make money on the spread. We are currently in a situation that raises particular risks for the ‘borrow short / lend long’ model, because short-term bond yields have risen to exceed long-term yields (which is referred to as an inverted yield curve or backwardation). The current 2-year Treasury bond yield crossed above 4% today, with the 10-year yield at 3.6%. The inverted yield curve tends to reduce banks’ net interest earnings but rising rates have a positive impact on interest income. My primary takeaway is that the current interest rate environment is a mixed bag for banks.
I last wrote about XLF on November 16, 2021, and I assigned a buy rating for XLF. At that time, the 10-year Treasury yield was 1.63% and XLF had returned a total of 51% over the past 12 months. From the market close on November 16, 2021 to today, XLF has returned -18.7%.

Seeking Alpha
Previous analysis of XLF and subsequent performance vs. the S&P 500 above.
In forming my outlook on a stock or ETF, I rely on the probabilistic outlook implied by options prices. The price of an option on an ETF is largely determined by the market’s consensus estimate of the probability that the ETF’s price will rise above (call option) or fall below (put option) a specific level (the option strike price) between now and when the option expires. By analyzing the prices of call and put options at a range of strike prices, all with the same expiration date, it is possible to calculate a probabilistic price forecast that reconciles the options prices. This is called the market-implied outlook. For a deeper explanation and background, I recommend this monograph published by the CFA Institute. In mid-November of 2021, the market-implied outlooks for XLF to January, March, and June of 2022 were slightly bullish.
The 10 months since my last post on XLF have been tumultuous, to say the least. Russia invaded Ukraine, contributing to inflation in food and energy prices. Russia’s subsequent shutdown of gas flowing to Europe has raised expectations of a recession there. Inflation has shot up in the U.S. and interest rates and bond yields have increased dramatically. The market is spooked by the potential recessionary impacts of Fed rate increases, although Jerome Powell has been consistent in his messaging. The flattening yield curve is seen as a potential warning of a coming recession and has reduced the expected benefits of rising interest rates for banks.
Market-Implied Outlooks for IYF
I have calculated market-implied outlooks for IYF for the 4-month period from now until January 20, 2023 and for the 8.8-month period from now until June 16, 2023, using the prices of call and put options that expire on these dates. I selected these two dates to provide a view to the start and middle of 2023, as well as because the options expiring in January and June tend to be among the most liquid.
The standard presentation of the market-implied outlook is a probability distribution of price return, with probability on the vertical axis and return on the horizontal.

Geoff Considine
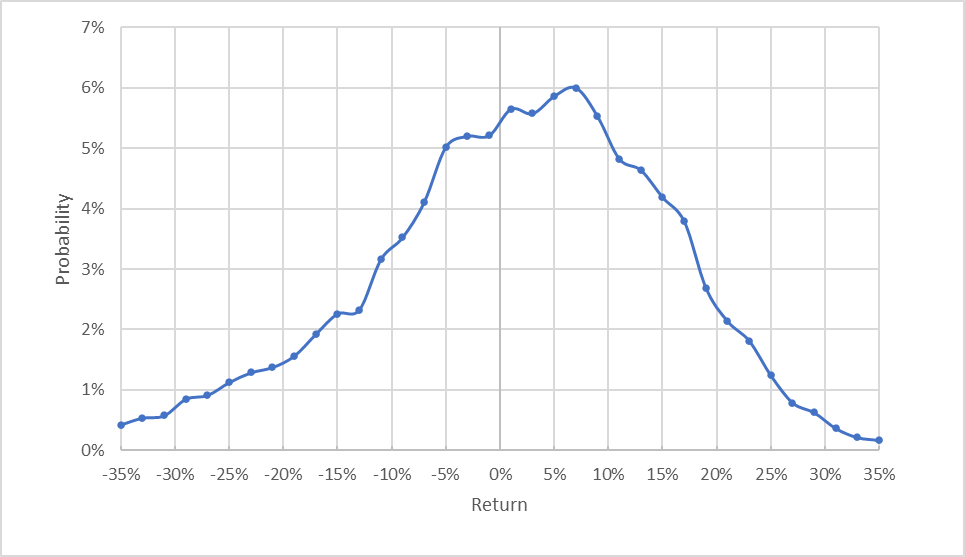
Market-implied price return probabilities for XLF for the 4-month period from now until January 20, 2023 above.
The market-implied outlook for XLF has the maximum-probability outcomes tilted to favor positive returns over the next 4 months. The peak in probability corresponds to a price return of 7% over this period. The expected volatility calculated from this distribution is 15.4% (26.8% annualized). An additional 0.5% in return is expected from dividends between now and January 20, 2023, bringing the peak-probability total return to 7.5%. The estimated 25th percentile return for the next 4 months is -7.1% (including the dividend). This means that XLF would be expected to return -7.1% or worse in the worst 1-in-4 outcomes for the next 4 months. This outlook suggests that XLF will provide a positive total return at a 58% probability.
Theory indicates that the market-implied outlook is expected to have a negative bias because investors, in aggregate, are risk-averse and thus tend to pay more than fair value for downside protection. There is no way to measure the magnitude of this bias, or whether it is even present, however. The expectation of a negative bias means that investors’ true expectations are probably more positive than the market-implied outlook indicates.
In my November analysis, I calculated a 4-month outlook for XLF that provides a point of comparison to the current 4-month outlook. The peak in probability in the previous 4-month outlook was at 2.25% and the expected volatility 12.7%. The updated 4-month outlook is considerably more favorable than the 4-month outlook published in November of 2021.
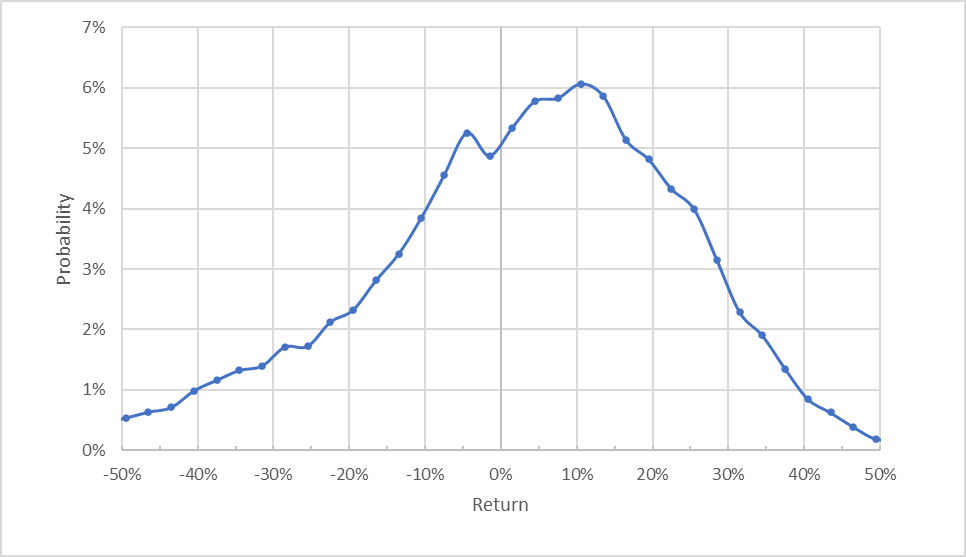
The market-implied outlook for XLF for the 8.8-month period from now until June 16, 2023 has a peak in probability corresponding to a price return of 10.5% and dividends over this period should contribute an additional 1%. This outlook puts the probability of a positive total return on XLF at 60%. The 25th percentile outcome corresponds to a price return of -10.4%. The expected volatility calculated from this distribution is 22.7% (26.5% annualized).

Geoff Considine
Market-implied price return probabilities for XLF for the 8.8-month period from now until June 16, 2023, above.
The market-implied outlooks for XLF are more bullish than they were back in November of 2021, with maximum probabilities for the 4- and 8.8-month outlooks that correspond to returns that would be quite attractive for XLF. The expected volatility for XLF is moderate. The options market indicates that XLF has improved odds of gains and expected volatility that is moderately higher than late last year.
Summary
XLF has now fallen to the point that it has given up most of the gains since the pre-COVID 2020 highs. While rising interest rates should be good for the financial firms that comprise most of XLF, the flattening yield curve reduces the potential gains in net interest income. XLF has followed the broader market downwards as investors sell off equities in response to rising rates, even as one might have expected that the positive correlation of XLF’s historical returns with bond yields might have provided some cover. The market-implied outlooks for XLF have gotten considerably more favorable since November of 2021, and currently suggest a decent risk-return tradeoff for XLF to the middle of 2023. This suggests that the options market is pricing in reasonable odds of a soft landing for the U.S. economy. The market-implied outlook contrasts to a litany of worrying news on the Fed’s attempts to tame inflation. The declines in XLF have priced in a lot of bad news, such that the outlook for financial firms is not bad.
[ad_2]
Source links Google News

