[ad_1]

Adrian Vidal/iStock via Getty Images
Investment Thesis
There are two key roles that dividend-paying investments can play: providing investors with income to help meet immediate cash needs – something that retirees might increasingly look to them for, particularly in low-interest-rate environments -and offering potential downside defense during market sell-offs. While not perfect, the dividend approach gives income investors a greater opportunity than a bond-only portfolio, especially when inflation is high, since companies can raise prices. In this article, I will review the Vanguard International High Dividend Yield ETF (NYSEARCA:VYMI) which provides exposure to a diversified basket of international dividend-paying stocks.
Strategy Details
The Vanguard International High Dividend Yield ETF tracks the performance of the FTSE All-World ex-US High Dividend Yield Index. The index is composed of firms that are located in developed and emerging markets, excluding the United States, that are expected to have above-average dividend yields. The index holds a broadly diversified collection of securities. Key characteristics include industry weightings and market capitalization, as well as certain financial measures, such as price/earnings ratio and dividend yield.
If you want to learn more about the strategy, please click here.
Portfolio Composition
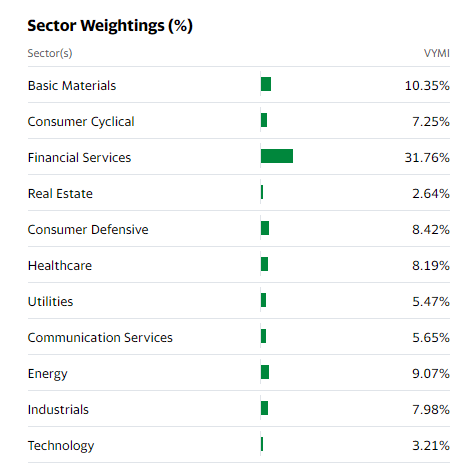
From the industry allocation chart below, we can see the index places a high weight on the financial services sector (representing around 32% of the index), followed by basic materials (accounting for 10% of the index) and Energy (representing around 9% of the fund). The largest three sectors have a combined allocation of approximately 51%.
Yahoo Finance
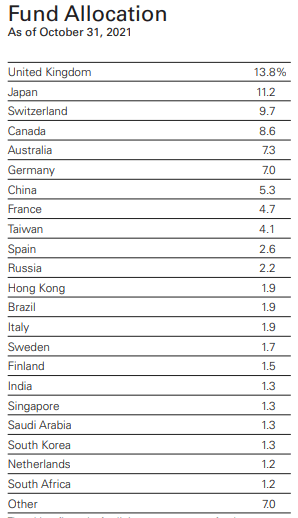
As of October 31st, 2021, the top ten countries represent approximately 75.52% of the portfolio in terms of geographical allocation. The United Kingdom has the largest allocation (13.8% of the fund), followed by Japan at 11.2% and Switzerland at 9.7%.
Vanguard
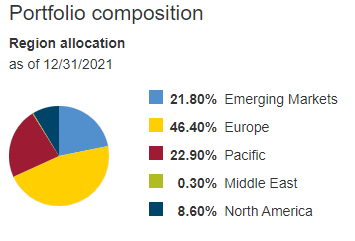
If we look at the region allocation, Europe represents ~46%, followed by Asia-Pacific (35.93% of the fund). It is interesting to see that some regions seem to be underrepresented given the relatively low allocation, such as the Middle East and North America. VYMI has a ~87% allocation to developed countries and a ~13% allocation to emerging countries.
Vanguard

etf.com
VYMI invests over 52.48% of the funds into Mega-cap, characterized as companies that have a market cap above $200 billion. The second-largest allocation is in Large-cap issuers, representing 33.34% of the ETF. These companies generally have a market capitalization above $10 billion. It is interesting to see that VYMI allocates less than 1% to small-cap issuers, which generally tend to perform better than large-cap stocks over long periods of time. I think the main explanation for this is the fact that large caps are typically mature companies that have limited growth prospects and generate excess cash.

Indmoney
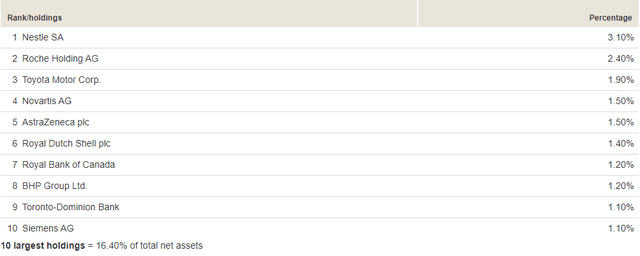
The fund is currently invested in 1,202 different stocks. The top ten holdings account for 16.40% of the portfolio, with no single stock weighting more than 4%. All in all, I would say that VYMI is very well-diversified.
Vanguard
Since we are dealing with equities, one important characteristic is the valuation of the portfolio. According to data from Morningstar, the fund currently trades at an average price-to-book ratio (P/B) of 1.23 and an average price-to-earnings ratio (P/E) of 9.83. It is important to point out that VYMI is cheaper than the index it is tracking, which has a P/B of 1.66 and a P/E of 13.36. In addition to that, the portfolio has had a return on equity of 9.45% since inception.
Is This ETF Right for Me?
VYMI has a distribution rate of 4.25%. Given the relatively high dividend yield, this ETF is suitable for the investor who is looking for a reliable source of income and some capital appreciation. Moreover, I like the fact that VYMI has been consistently raising its dividend since its inception.

Seeking Alpha
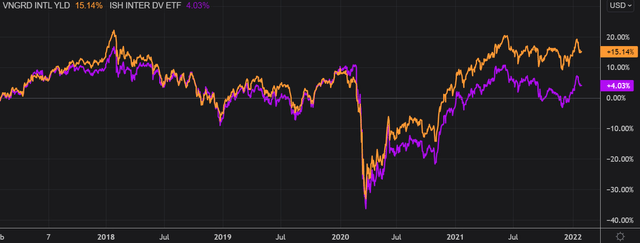
If we turn to capital appreciation, VYMI offers stable returns, although I do not think that you should expect this strategy to beat an index like the Nasdaq 100 over a long period of time. I have compared below the price performance of VYMI against the price performance of the iShares International Select Dividend ETF (NYSEARCA:IDV) over 5 years to assess which one was a better investment. Over that period, VYMI outperformed IDV and even had less drawdown during the COVID-19 crash in early 2020. Compared to IDV, VYMI rose by more than 11 percentage points at the end of the 5-year period. To put it into perspective, a $100 investment in VYMI five years ago would now be worth $115.14. This represents a CAGR of ~3%, which is an average return over that period if you compare it to the S&P 500.
Refinitiv Eikon
Key Takeaways
VYMI offers exposure to a basket of international quality dividend payers. I like the fact that the ETF is well-diversified, both across sectors and constituents. Moreover, VYMI offers a better value for money than a plain vanilla S&P 500 ETF or its own benchmark which is trading at higher multiples, offering a lower valuation and a higher dividend yield. VYMI gives you exposure to international markets, which is a good thing for investors that are looking to diversify their portfolio outside the US. I would personally not purchase VYMI for capital gains reasons, but most likely for the attractive yield and the dividend growth.
[ad_2]
Source links Google News

