[ad_1]
Torsten Asmus
(This article was co-produced with Hoya Capital Real Estate.)
In my most recent article here on Seeking Alpha, I reviewed Vanguard Short-Term Bond ETF (BSV), in the process explaining why BSV is the largest holding in my personal portfolio.
This article was in line with most of my previous writing on bonds, largely focused on the shorter end of the spectrum. In addition to BSV, I have covered total-U.S. market bond ETFs funds such as Vanguard Total Bond Market Index Fund ETF (BND) and iShares Core U.S. Aggregate Bond ETF (AGG).
At the same time, here is how I concluded that article on BSV.
At this very interesting time, I am watching very closely the direction of interest rates and the actions of the Fed.
You see, right now my personal weighting is roughly 15% in BSV, 10% in AGG, and 3% in iShares 20+ Year Treasury Bond ETF (TLT). As we get closer to a point where I believe the Fed is done with interest rate increases, I may consider lessening my weighting in BSV in favor of slightly heavier weightings in the other 2 ETFs.
Why? For two reasons. First, to potentially achieve a slightly higher level of income. Second, since the price of bonds moves inversely of interest rates, there might be a point where the potential for capital gains is greater in the longer-term ETFs.
Related to that, even more recently I encouraged investors to keep an eye on bonds, suggesting that the risk/reward proposition is gradually getting better and better.
This whole train of thought led me to take my first ever look at Vanguard Long-Term Bond ETF (NYSEARCA:BLV).
Why Is This My First Review Of BLV?
Until now, I hadn’t had much interest in a longer-term offering such as BLV. Due to the historically low interest rate environment in which we have found ourselves for years, I developed my personal portfolio around a combination of U.S. and international stocks buffered with an allocation to shorter-duration bonds. The goal of my bond allocation was to provide some measure of current income, while simultaneously sheltering my portfolio in the event of a severe downturn.
In contrast, I felt that were we to find ourselves in an environment of rising interest rates, the longer end of the duration spectrum carried too much downside price risk to offset the slightly higher income such bonds provided.
That viewpoint was certainly not incorrect. Have a look at the YTD price performance for BLV, compared against BSV and BND.
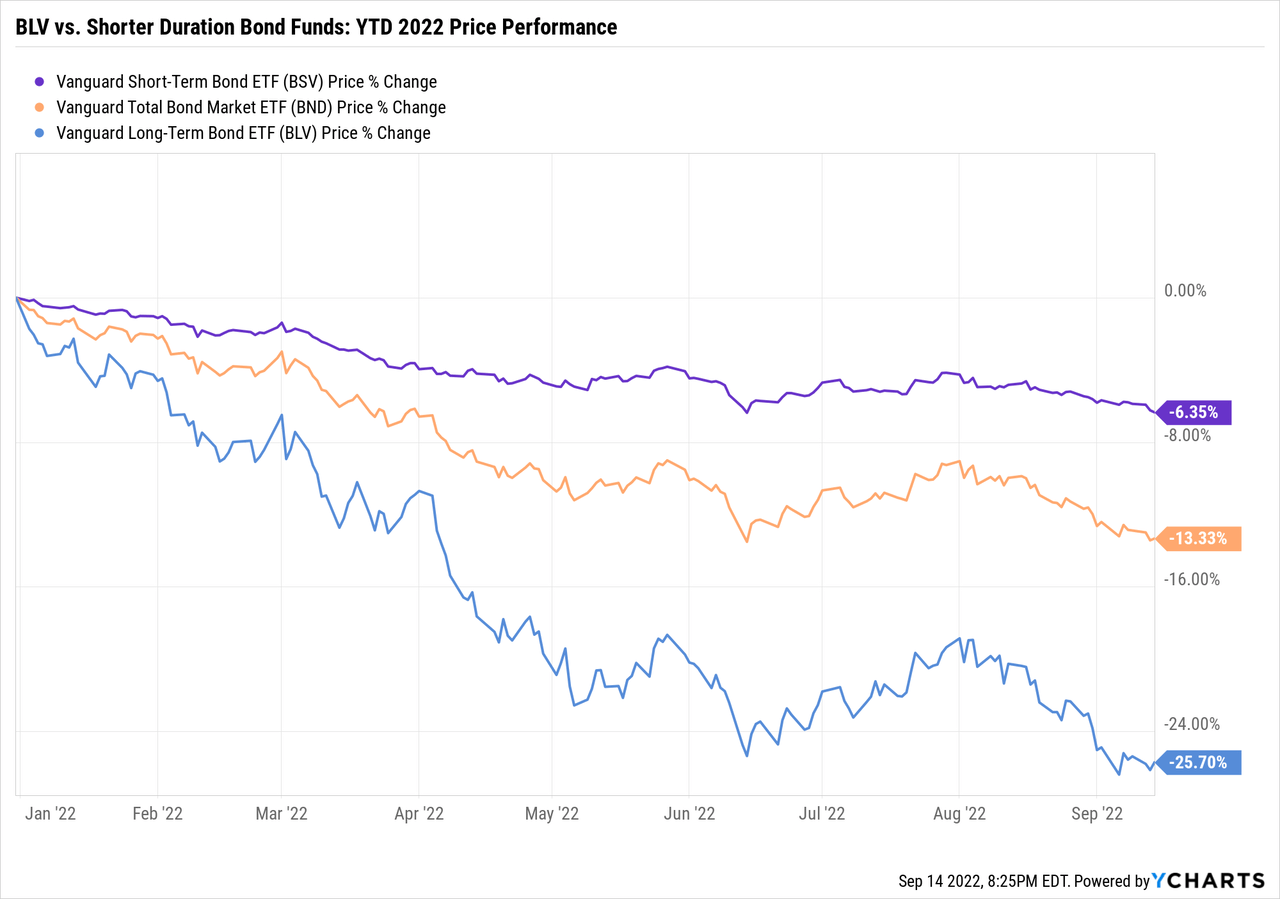
In summary, while all 3 holdings are down significantly in the worst year for bonds in more than 40 years, BLV is by far and away the worst performer. Certainly, I have no regrets for omitting this ETF from my portfolio thus far.
However, we now find ourselves in a changing environment. In one of my more recent articles here on Seeking Alpha, I explained why what I refer to as “the world of 4,818” faces an uncertain future. One of the reasons for that is that Jerome Powell has been unequivocal in stating that the Fed’s “overarching focus right now is to bring inflation down to our 2 percent goal.”
Following the release of the August CPI report, which climbed 8.3% from a year earlier in spite of declining gasoline prices, almost all observers expect the Fed to implement another .75% increase, and some suggest a full 1% increase to get ahead of the curve.
I’ll briefly summarize in the conclusion what that could mean for investors in BLV. For now, though, let’s take a look at the fund itself.
Vanguard Long-Term Bond ETF – Digging In
Particularly in this area of your portfolio, where your main goal is to generate income as opposed to capital gains, controlling your expenses is important. With an ultra-low expense ratio of .04%, BLV certainly meets this test.
From Vanguard’s summary prospectus for BLV, here is a little more color concerning the underlying index it tracks.
Principal Investment Strategies
The Fund employs an indexing investment approach designed to track the performance of the Bloomberg U.S. Long Government/Credit Float Adjusted Index. This Index includes all medium and larger issues of U.S. government, investment-grade corporate, and investment-grade international dollar-denominated bonds that have maturities of greater than 10 years and are publicly issued.
From the Vanguard web page for BLV, here is a more detailed breakdown of BSV’s composition. First, by credit quality.
BLV: Distribution By Credit Quality (Vanguard)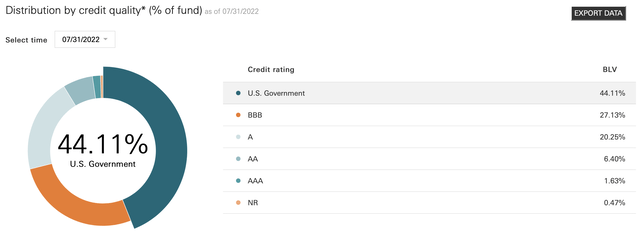
A solid focus on Treasuries gives this portfolio a high-quality credit profile. In addition to the 44.11% allocation to U.S. government bonds, an additional 1.63% is AAA-rated, meaning that some 46% of the fund it is parked in AAA bonds.
At the other end of the spectrum, however, please take note of the fact that BBB-rated bonds are the second-highest-weighted segment in terms of credit quality. This is the lowest investment-grade rating. Clearly, then, the fund doesn’t eliminate credit risk, but it should hold up better than most when credit spreads widen. The balance of the fund is in relatively safe AA and A-rated bonds.
Second, we turn to effective maturity.
BLV: Distribution By Effective Maturity (Vanguard)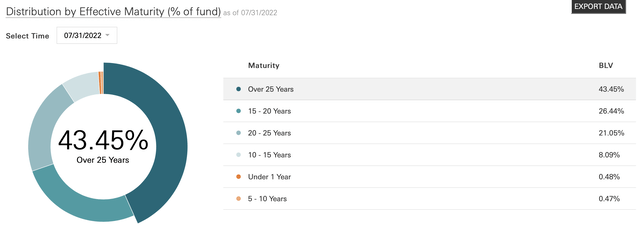
The average effective maturity of the fund is 23.1 years, and the average duration is 15.0 years. If you are unclear on the difference between maturity and duration, I explain it in this article.
Summary & Outlook
Similar to my recent article on BSV, I will end this article with a section entitled “summary and outlook” as opposed to “summary and conclusion.”
To explain why, let me repeat one small snippet from that prior article that I featured in the opening of this article.
As we get closer to a point where I believe the Fed is done with interest rate increases, I may consider lessening my weighting in BSV in favor of slightly heavier weightings in the other 2 ETFs.
As I hope I have carefully explained in this article, interest rate risk forms a large component of your evaluation of BLV, given its long-term maturity and duration profile. It is precisely this risk that was realized this past year, in the 25% or so YTD price decline.
But, as investors, we have to look forwards, not backwards.
As I featured in this article, there appears to be a chance that the Fed, after several sizable interest rate increases, takes a pause around the end of 2022 to size up the effects on the economy. It is at this point that I feel that most, and possibly all, of the interest rate risk in BLV may already be priced in.
As I finalize this article, the SEC 30-day yield on BLV sits at 4.51%. So, if we assume a slight further price decrease into the end of 2022, that yield could be approaching the 5% mark. In other words, even if there are slightly further price declines, that healthy yield would cover you to a certain extent. On the flip side, if interest rates stabilize and even decrease in the event of recession, you could reap capital gains over time while raking in that 5% yield in the interim.
Here’s one last data point for you to consider. In addition to interest rate risk, I featured that BLV exposes investors to a measure of credit risk. To what extent are investors being compensated for this risk?
To answer this question, let’s take a quick look at the one long-term bond ETF I currently hold in my portfolio, iShares 20+ Year Treasury Bond ETF (TLT).
Here, from the iShares web page, are the portfolio characteristics for TLT.
TLT: Portfolio Characteristics (iShares)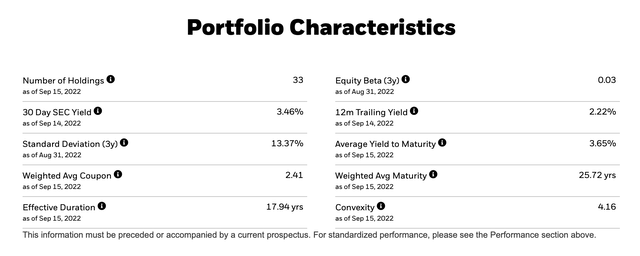
Let’s quickly evaluate BLV against TLT. First, as can be seen, TLT’s 30-day SEC yield currently stands at 3.46%, compared to 4.51% for BLV. Second, please note that TLT’s effective maturity and duration are roughly 2 years longer than BLV.
In other words, if you decide to accept the higher level of credit risk associated with BLV, you are rewarded with roughly an additional 1% of yield, and slightly lower interest rate risk.
What do you think? It’s an interesting dilemma isn’t it? As December approaches, I plan to circle back and evaluate adding BLV to my portfolio.
I’d love to hear from you in the comments section below!
[ad_2]
Source links Google News

