[ad_1]

peshkov/iStock via Getty Images
Oil and Gas stocks have performed extremely well over the past few years since the generational buying opportunity that occurred at the start of the pandemic. In total return terms the Vanguard Energy ETF (VDE) has gained 234% since its 2020 lows, hugely outperforming the S&P500. Despite such strong returns, the current oil price suggests the VDE should be roughly double its current share of the market based on correlations over the past two decades.
The VDE ETF
The VDE seeks to track the performance of U.S. energy stocks as classified by GICS. The fund diversifies its holdings by applying limits on regulated investment companies using the MSCI 25/50 methodology, such that no group entity exceeds 25% of index weight and the aggregate weight of issuers with over 5% weight in the index are capped at 50% of the portfolio. As a result, the VDE is slightly more diversified than the larger Energy Sector Select SPDR ETF (XLE), with the two largest companies, Exxon and Chevron, comprising 38% of the index versus 44% for the XLE. Meanwhile, the top 10 companies make up 67% of the index versus 76% for the XLE. The VDE’s dividend has dropped significantly from the 9% levels seen in early 2020, the 3.3% figure is still more than double the S&P500.
Upside Momentum Is Building
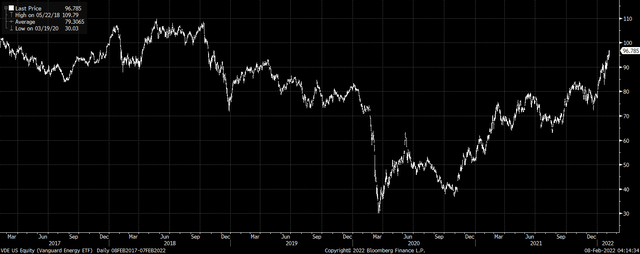
The VDE chart pattern looks particularly strong, with dips becoming increasingly shallow as the rally progresses. The next meaningful level of resistance is around USD110 coinciding with the May 2018 high.

VDE ETF (Bloomberg)
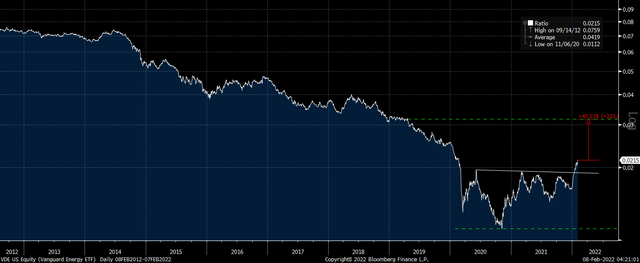
The ratio of the VDE over the S&P500 looks even more attractive. The ratio triggered an inverse head-and-shoulder reversal pattern last month, with the measured move target almost 50% above current levels.

VDE Vs SPX (Bloomberg)
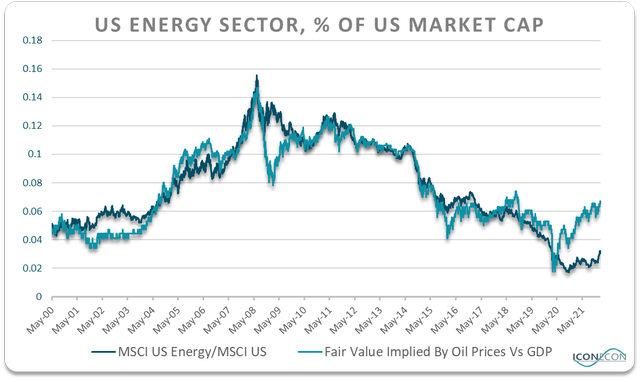
The technical picture chimes with the fundamental outlook as oil prices continue their march higher. The chart below shows the correlation between WTI crude relative to GDP and the energy sector’s share of the MSCI USA Energy index. Based on this correlation, the VDE is still 50% below the fair value as the ongoing rally in crude oil continues to warrant higher energy stock prices.

Bloomberg, Author’s calculations
The surge in oil prices is being reflected in the VDE’s forward price-to-earnings ratio which now sits at just 12.7x, roughly 40% below the S&P500. On a forward Enterprise Value-to-EBITDA basis, the energy sector is trading at an even larger discount, with the VDE currently at 6.6x versus 13.7x for the S&P500.
Even more impressive is the forward price-to-free cash flow ratio. With oil majors reducing their capital expenditure substantially in recent years, the estimated price-to-FCF is just 10.3x, versus 24.2x for the S&P500 ex-Financials index. Surging free cash flows should allow the VDE’s dividend yield to remain at or above the current 3.3% level assuming no increase in the ETF’s price.
Recession Poses A Risk, But VDE May Still Outperform
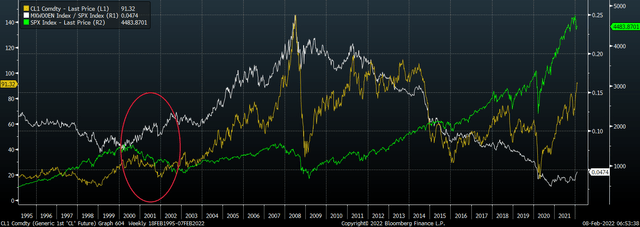
The biggest risk to the VDE comes from renewed weakness in oil and equity prices that a slowdown in economic growth or a recession would likely trigger. Energy stocks tend to be more volatile than the broader market and particularly susceptible to periods of credit stress. However, the current market climate shows a number of similarities to the 2000 peak. Interestingly, the MSCI USA Energy index actually outperformed the S&P500 during the 2000-2002 equity bear market even as crude oil prices fell amid the economic slowdown.

WTI, SPX, and MSCI Energy/SPX (Bloomberg)
Summary
With oil prices at current levels, the VDE should continue to outperform as investors take advantage of the still-elevated valuation gap. The VDE’s underlying MSCI USA Energy index trades roughly 40% below the S&P500 on a forward P/E basis, and more than 50% below it in terms of price-to-free cash flow. While a sharp decline in oil prices and/or the S&P500 pose risks to the VDE, energy stocks outperformed during the 2000-2002 equity bear market even as crude oil prices fell amid the economic slowdown.
[ad_2]
Source links Google News

