
The Markets May Be Setting Up For A Big Bear Market Move Down

The Markets Have Been Extremely Volatile And A Bear Market May Start
If you follow the stock market and even if you don’t then you have probably heard that the market is moving up and down with huge volatility. The Dow Jones Industrial Average has moved in 1000 point increments in the last week. Down 1000 then up 1000 and many market watchers haven’t seen this type of movement before. We want to see whether we can determine if we are on the verge of entering a Bear Market.
We are chart watchers which means we look at chart patterns and indicators as a way to make informed guesses on the direction of the markets. Once we make this informed guess on the direction we then determine which ETF’s we will use for Trading. We have noticed that there are certain patterns that have formed on 4 ETF’s and 1 Futures Contract that could determine the next move in the market. If the patterns and our assumptions are correct then we could possibly be entering a Bear Market rather quickly. Let’s take a look at these patterns and give our analysis that hopefully can answer the question of whether we are heading into a Bear Market.
TQQQ Chart Shows That A Big Move Is Coming In The Markets
This first chart is of the TQQQ ETF (3x Leveraged ETF) and notice the rising wedge (white triangle) suggesting a resolution to this pattern is coming. Also notice that the lower Bollinger Band in Blue is still declining despite the couple days of price moving up. Third, notice that our Proprietary Oscillator is still moving down and has now crossed down below the red line (Zero Line). One last note on this chart is that price is still above the 200 Day Moving Average but our Oscillator has given a Sell Signal. This chart will resolve one way or the other and our assumption is down but we’ll know very soon if we our headed into a Bear Market or not.

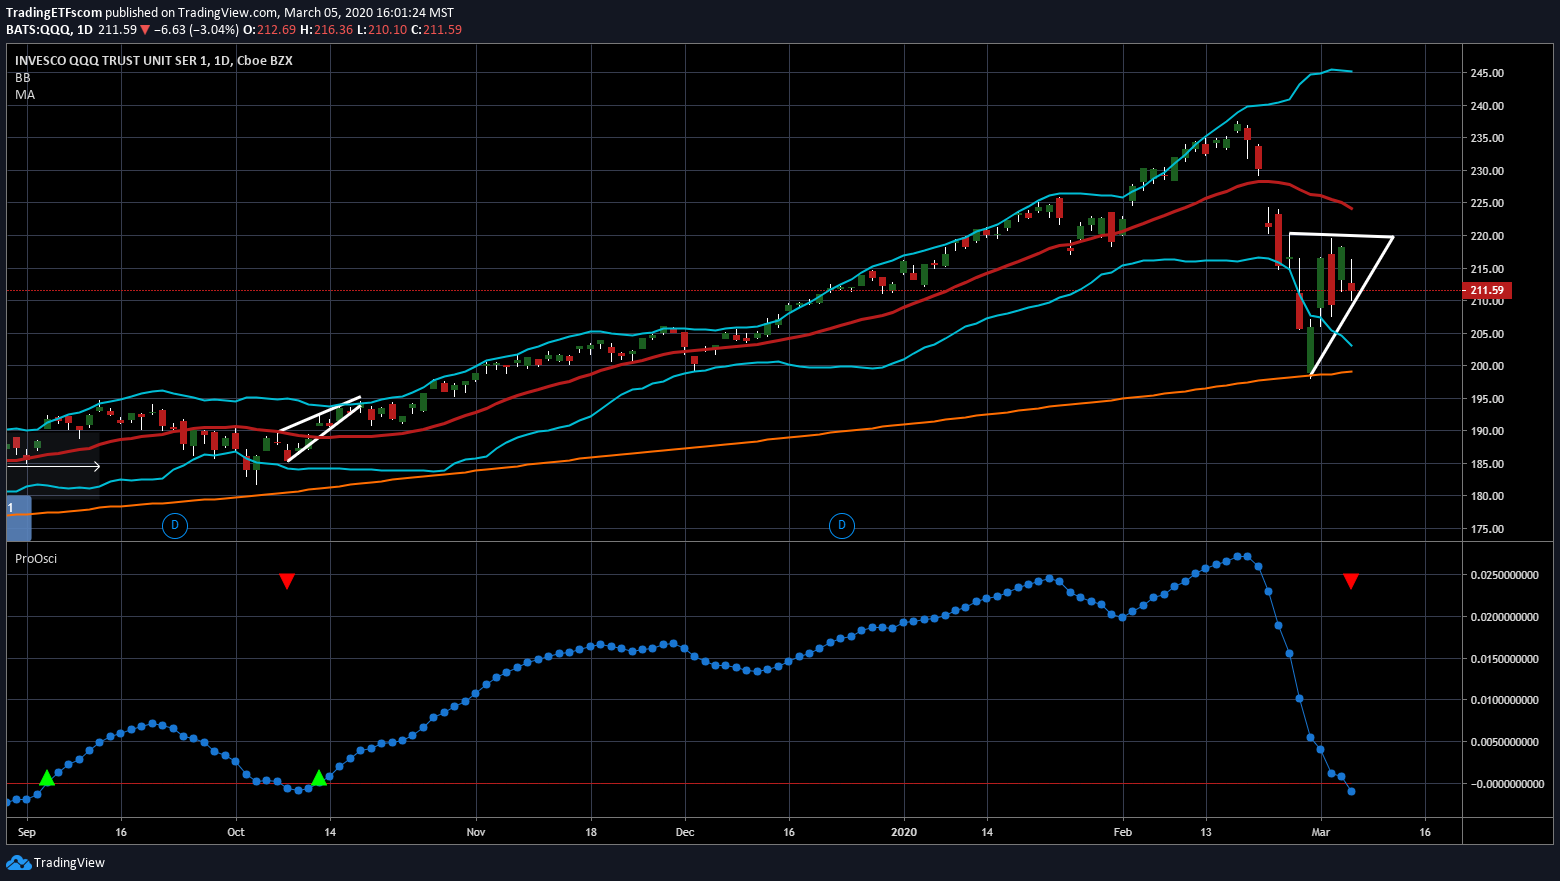
QQQ Chart Also Shows A Very large Move Coming
The Chart of the QQQ which holds the largest technology companies is also showing the same type of rising wedge pattern, a falling Bollinger Band and our Oscillator moving down below the zero line. Our Oscillator crossing down below the zero line is a sell signal. This pattern also suggests a very big move is coming and putting everything together our assumption is the chart price goes down but we will know very soon.
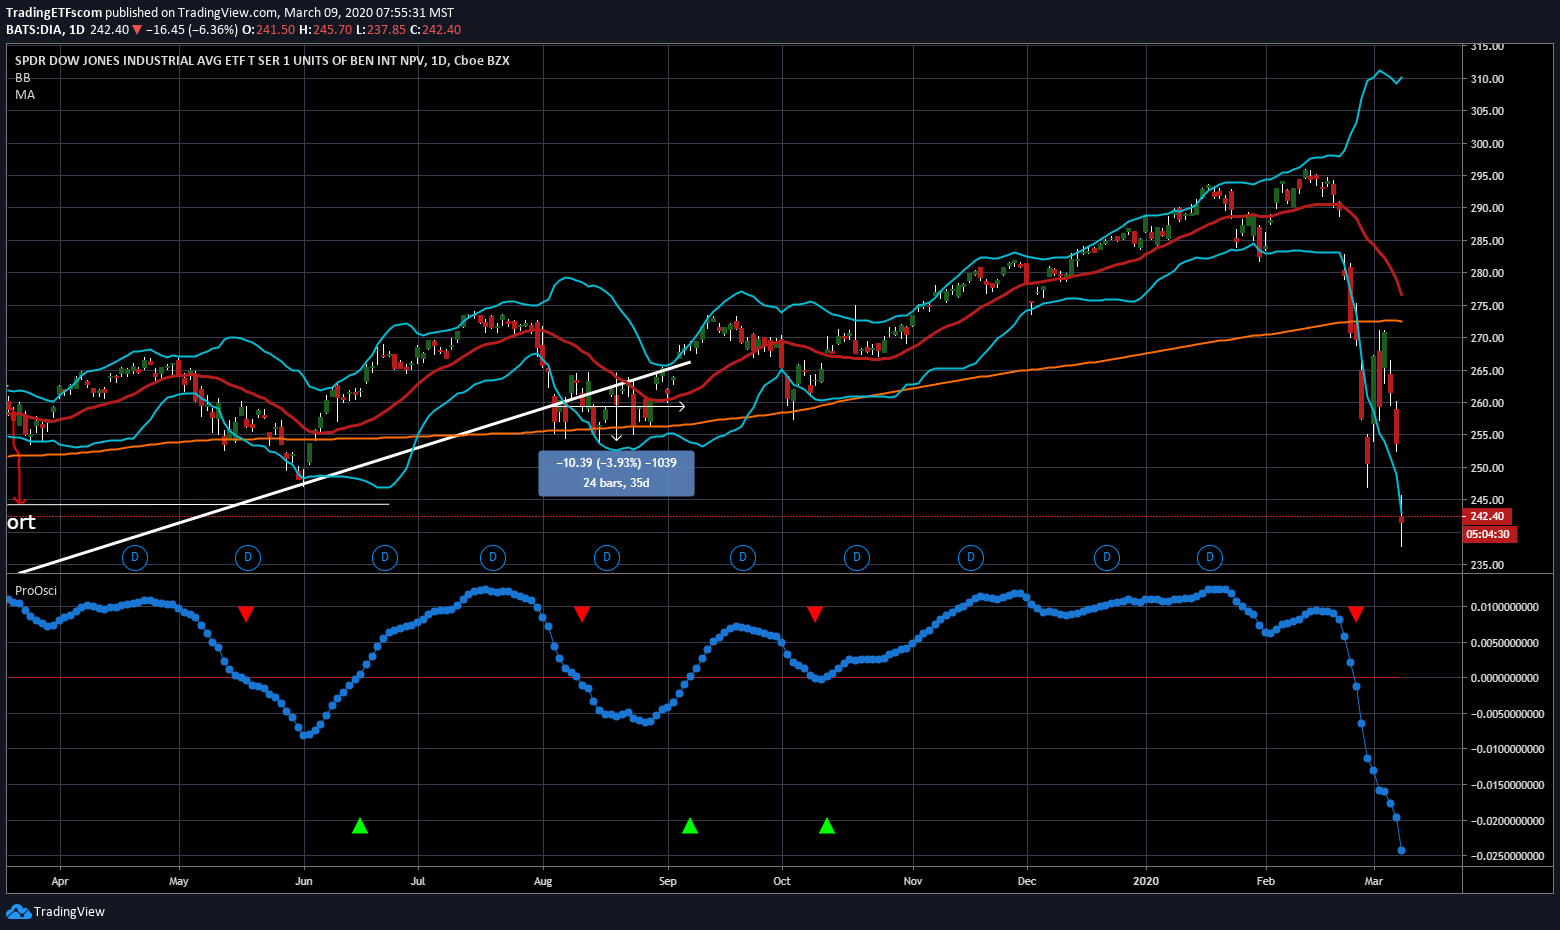
DIA ETF Showing The Same Big Move Coming
The DIA (aka Diamond ETF) has this same 3 red flags. A rising wedge after a big downtrend, the Bollinger Band still moving down and our Oscillator still moving down although unlike the 2 charts above, our Oscillator went below the zero line 7 days ago. This also suggests a big moving coming and once again our assumption is to the downside.

*** Updated Chart To Reflect This Big Move ***
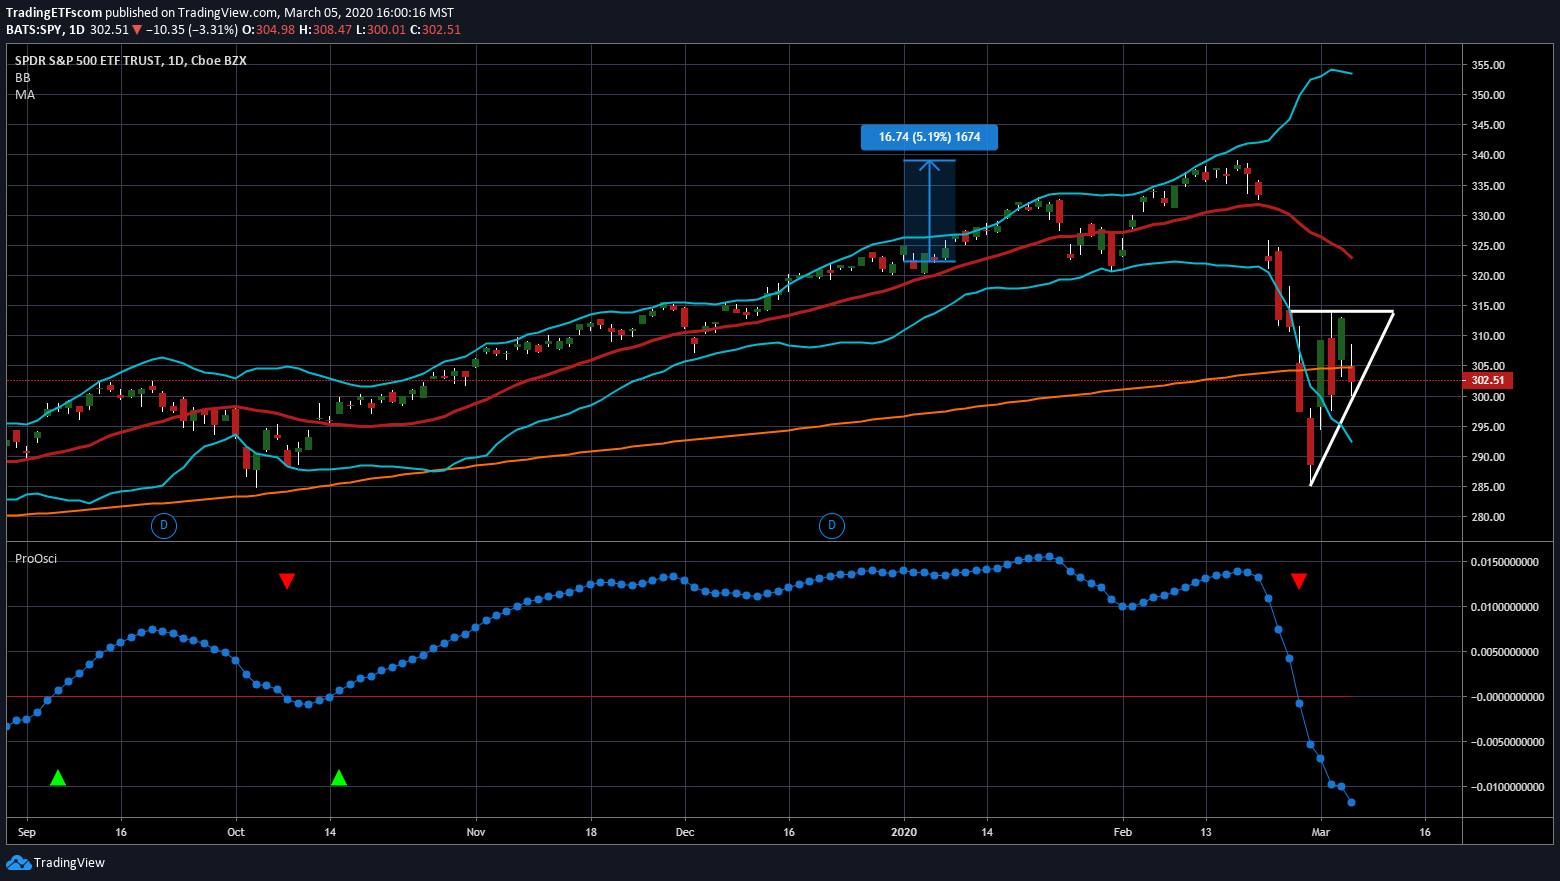
SPY ETF Looks Very Similar To The DIA Chart Above
Once again, notice the rising wedge, falling Bollinger Band and our Oscillator continuing to move down even after crossing down below the zero line 6 days ago. Still looks like price is going down and may be the start of a Bear Market.
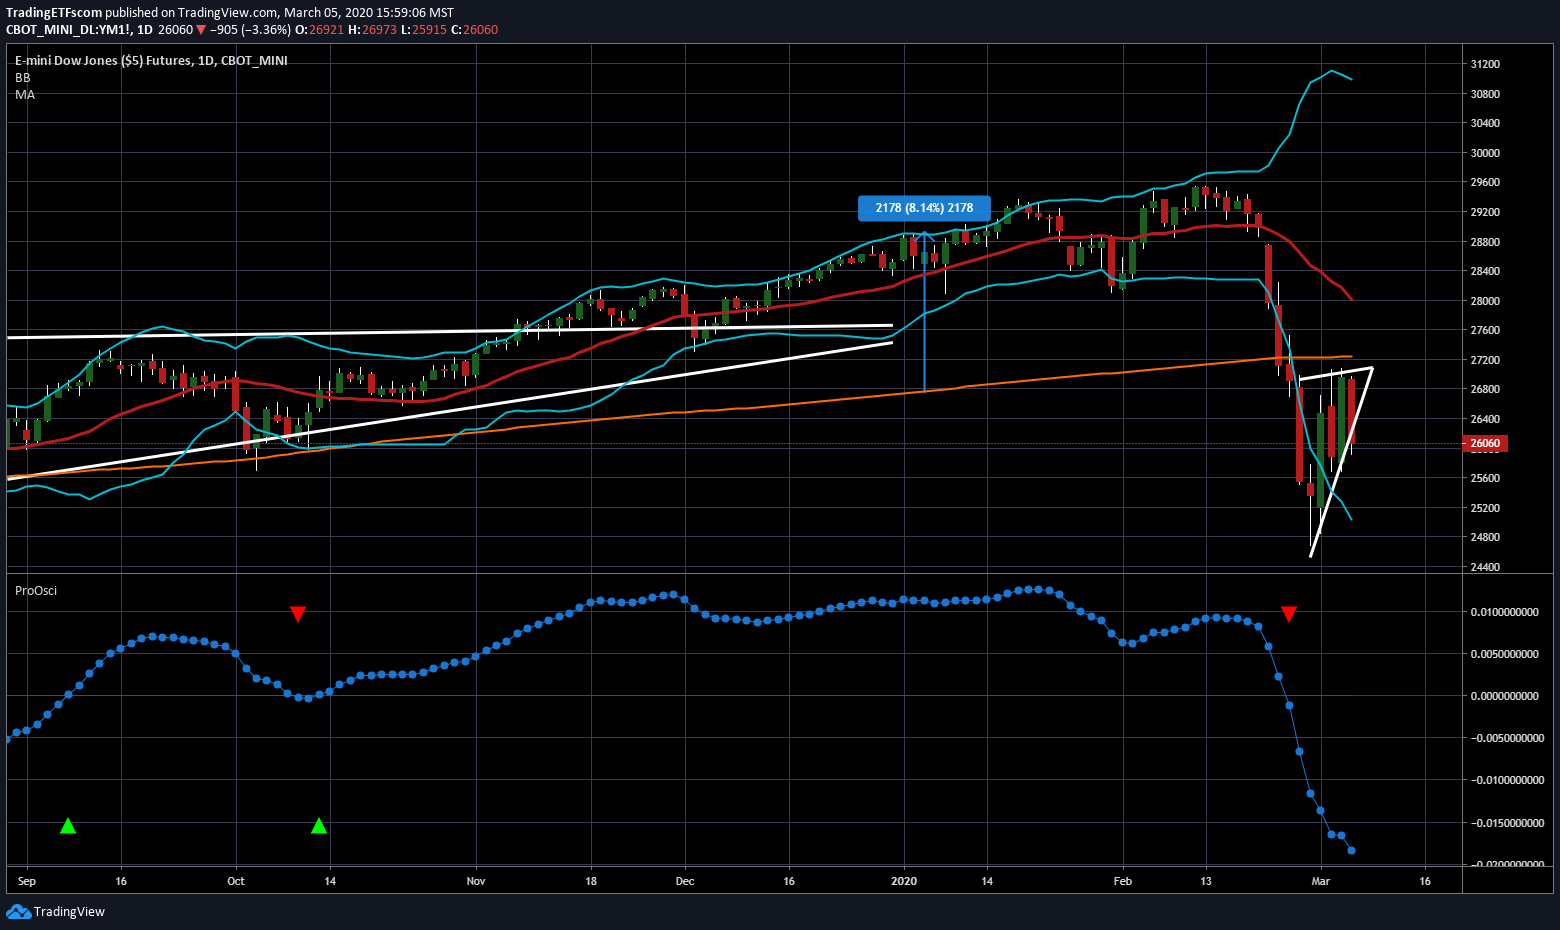
Do The Futures Tell Us Anything Different?
This chart below is the Down Jones Futures Chart. This chart has the same exact 3 concerns. A rising wedge pattern after a downfall, a falling Bollinger Band and our Oscillator continuing to fall down. The Futures chart shows that even big money which are the ones who trade the Futures markets are just as concerned as everyone else in the markets. We would keep an eye on the Futures markets that may reflect any bad news that will affect the next day’s trading.
We Provided A Video Update For These Charts
Our Conclusion
Looking at these 5 different charts and seeing the same 3 red flags on each one of them should cause concern for Traders and Investors. If the charts do not resolve themselves by moving up in price despite the indicators and chart pattern showing a move down then we may be right on the Verge of entering a Bear Market. Does anyone even know what that is today?
You might also be interested in our Sell signal on TQQQ posted back on Feb 10, 2020 here: https://tradingetfs.com//avoid-big-losses-trading-tqqq/
You might also be interested in our Sell signal on SMH here: https://tradingetfs.com//avoid-trading-etfs-like-smh/
You might also be interested in our VXX Buy Signal here: https://tradingetfs.com//trading-etfs-while-volatility-explodes-higher/
******All Charts Provided by TradingView.com. If you would like to try using these charts just click here: TradingView.com