[ad_1]
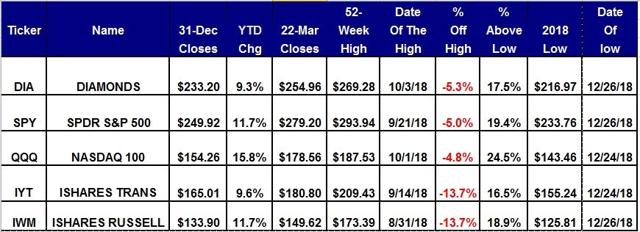
Today, I show the daily charts with their key technical levels.
Here’s Today’s Scorecard
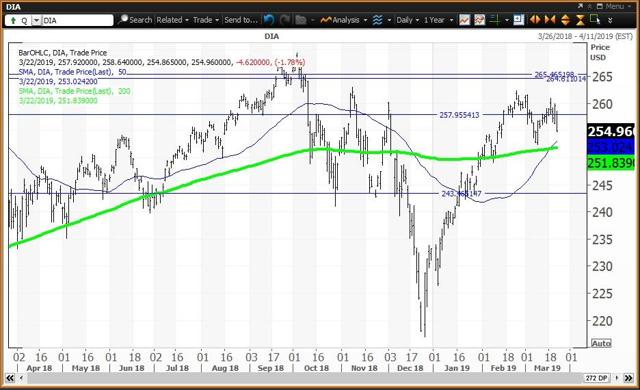
SPDR Dow Jones Industrial Average ETF (NYSEARCA:DIA)
 Courtesy of MetaStock Xenith
The Diamonds ETF is 17.5% above its 2018 low of $216.97 set on Dec. 26 and is 5.3% below its all-time intraday high of $269.28 set on Oct. 3. Remember that Dec. 26 low was a “key reversal” day as the close was above the Dec. 24 high. Buy weakness to my semiannual value level at $243.47 and reduce holdings on strength to my annual pivot at $257.94.
The weekly chart for Diamonds is positive but overbought, with the ETF above its five-week modified moving average at $254.27. DIA is well above its 200-week simple moving average or “reversion to the mean” at $211.12. The 12x3x3 weekly slow stochastic reading slipped to 86.48 last week, down from 87.43 on March 15. A weekly close below $254.27 results in a downgrade.
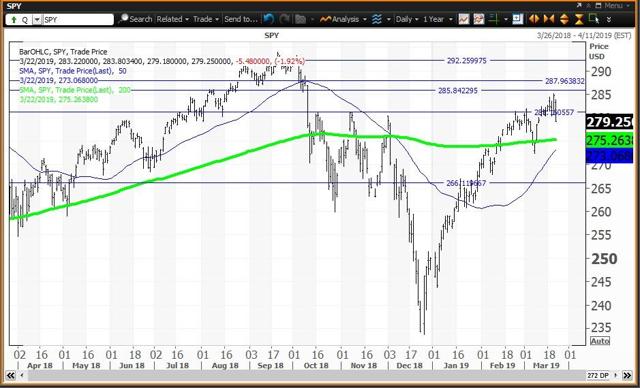
SPDR S&P 500 Trust ETF (NYSEARCA:SPY)
 Courtesy of Refinitiv XENITH
The Spiders ETF is 19.4% above its Dec. 26 low of $233.76 and is 5% below its all-time intraday high of $293.94 on Sept. 21. Remember that Dec. 26 was a “key reversal” day as the close was above the Dec. 24 high. Buy weakness to my semiannual value level at $266.14 and reduce holdings on strength to my annual risky level at $285.86. The ETF is below my monthly pivot at 281.13.
The weekly chart for Spiders is positive but overbought, with the ETF above its five-week modified moving average at $275.16. SPY is above its 200-week simple moving average or “reversion to the mean” at $238.43 after this average held at $234.71 during the week of Dec. 28. The 12x3x3 weekly slow stochastic reading rose to 88.80 last week, up from 88.51 on March 15, moving further above the overbought threshold of 80.00. SPY may be a week away from becoming an “inflating parabolic bubble” with a reading above 90.00.
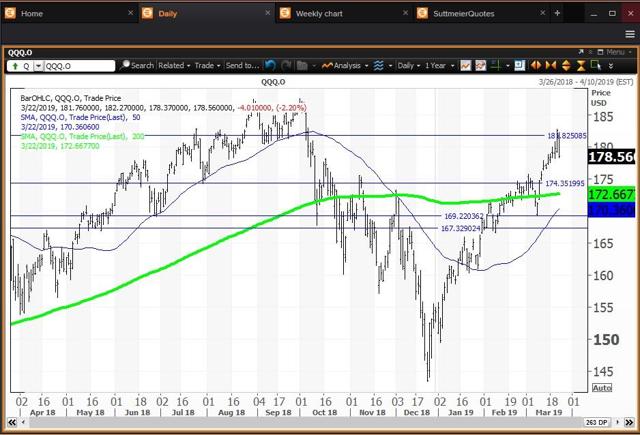
Invesco QQQ ETF (NASDAQ:QQQ)
 Courtesy of Refinitiv XENITH
The QQQ ETF is still in bull market territory 24.5% above its 2018 low of $143.46 on Dec. 24. QQQ is 4.8% below its all-time intraday high of $187.53 set on Oct. 1. Buy weakness to my annual and semiannual value levels at $169.27 and $167.53, respectively, and reduce holdings on strength to its weekly risky level at $183.83. Its monthly pivot is $174.43.
The weekly chart for QQQ is positive but overbought, with the ETF above its five-week modified moving average at $172.48. QQQ is above its 200-week simple moving average or “reversion to the mean” at $137.34. The 12x3x3 weekly slow stochastic reading rose to 90.09 last week, up from 89.89 on March 15, moving further above the overbought threshold of 80.00. The reading above 90.00 makes QQQ an “inflating parabolic bubble.”
iShares Transportation Average ETF (NYSEARCA:IYT)
 Courtesy of Refinitiv XENITH
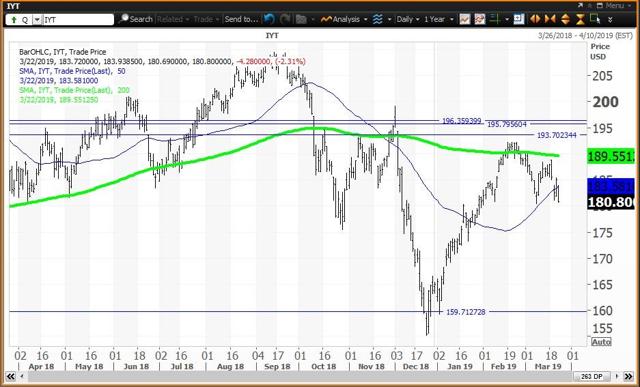
IYT is 16.5% above its 2018 low of $155.24 set on Dec. 24. The ETF is also in correction territory 13.7% below its all-time intraday high of $209.43 on Sept. 14. Buy weakness to my semiannual value level at $159.63 and reduce holdings on strength to monthly, quarterly and annual risky levels at $193.67, $195.81 and $196.35, respectively.
The weekly chart for IYT has been downgraded to negative, with the ETF below its five-week modified moving average at $183.58. The ETF is above its 200-week simple moving average or “reversion to the mean” at $165.33. The 12x3x3 weekly slow stochastic reading fell to 75.75 last week from 76.42 on March 15.
iShares Russell 2000 ETF (NYSEARCA:IWM)
 Courtesy of Refinitiv XENITH
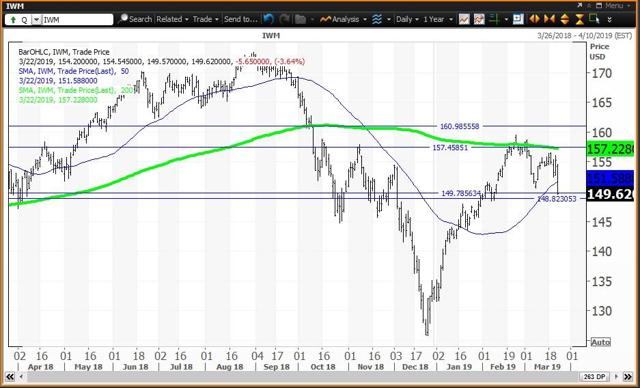
IWM is 18.9% above its 2018 low of $125.81 set on Dec. 26 and in correction territory 13.7% below its all-time intraday high of $173.39 set on Aug. 31. Buy weakness to the 200-week simple moving average at $136.19. Semiannual and monthly pivots are $149.77 and $148.81, respectively. Reduce holdings on strength to my annual and quarterly risky levels at $157.49 and $160.93, respectively.
The weekly chart for IWM is neutral, with the ETF below its five-week modified moving average at $151.78. The ETF is above its 200-week SMA or “reversion to the mean” at $136.19. The 12x3x3 weekly slow stochastic reading slipped to 83.04 last week from 86.68 on March 15, with both readings above the overbought threshold of 80.00. The weekly chart becomes negative given a close this week below $151.78 and with the stochastic reading falling below 80.00.
Disclosure: I/we have no positions in any stocks mentioned, and no plans to initiate any positions within the next 72 hours. I wrote this article myself, and it expresses my own opinions. I am not receiving compensation for it (other than from Seeking Alpha). I have no business relationship with any company whose stock is mentioned in this article.
[ad_2]
Source link Google News


