[ad_1]
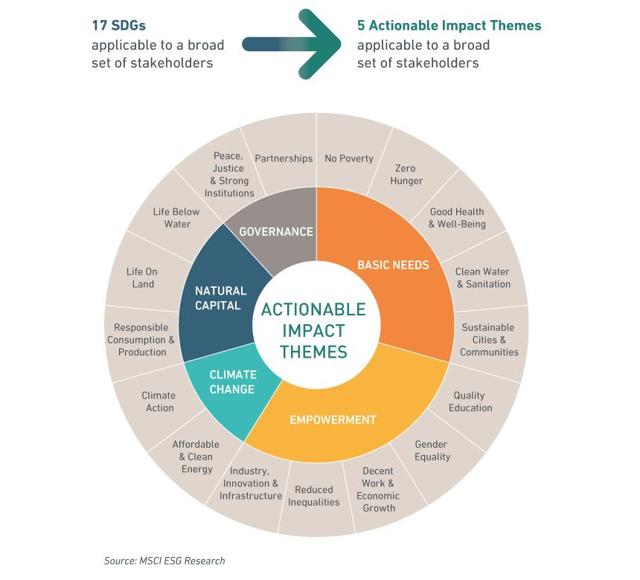
So I previously wrote about a few funds dedicated to investing according to religious values. There are also funds dedicated to investing according to social values. The iShares MSCI Global Impact ETF (SDG) is one such fund that is dedicated to investing according to the United Nations’ Sustainable Development Goals. These goals are related to basic needs, empowerment, climate change and natural capital – see the graphic below to see what goals this ETF’s index targets. You can also check out the United Nations’ website dedicated to their Sustainable Development Goals.

Make sure that investment choices actually implement goals and aren’t contradictory.
While there are criticisms of the United Nations, such as the election of the Saudis to the Women’s Rights Commission, I believe that most of these goals are rather honourable in principle, but there can be some issues in implementation. Sometimes, some goals may be in conflict with others. I’m from Canada, as some of my earlier followers may have inferred from my original red maple leaf photo. The natural resources sector (energy and mining) is very important to my country; it has strong environmental regulations which provide jobs and help reduce poverty, particularly amongst Aboriginal peoples (many of whom have a lack of clean water) – however, Canada still has to import oil from countries such as Saudi Arabia (which is notorious for its human rights abuses and has weaker environmental regulations) due to a lack of infrastructure. Not allowing more infrastructure to be built would mean that Canada may have to import oil from other countries with weaker social and environmental policies. Sure, it’s not perfect and there is the issue of CO2 emissions – this is somewhere where social progress and alternative energy goals would come into conflict.
What about alternative energy? Government officials and politicians (of any party) often don’t act and implement policies that have the best results even if they have the best intentions due to mismatching of incentives, and usually do things based on votes and special interests (see Public Choice Theory). In Ontario, where I’m originally from, the previous government (party not relevant for this analysis) replaced natural gas plants with wind turbines in order to reduce carbon emissions. However, evidence suggests that those policies may have actually increased emissions as wind and solar (which require a natural gas backup) produced energy at 200 grams of CO2/KWh compared to the baseline production of less than 40g (see here and here) – which is completely contrary to reducing emissions but is technically ‘green energy.’ Ontario also has among the highest electricity rates in North America due to these changes – hurting poor people the most. So while solar and wind may sound good to proponents of alternative energy, there’s a lot of other factors that go into it. Other things like biomass combustion end up producing greater CO2 emissions and have other negative environmental effects but are often included as part of ‘green’ energy, while nuclear which provides large amounts of clean, safe power are not included. If you care about the environment, social responsibilities and the stated goals of this fund, you want to make sure that the fund actually invests based on the implementations of these goals and not blindly investing in companies that may have the effect of rewarding bad implementations.
Basic Facts
Expense Ratio: 0.49%
Price: ~$56
Net Assets: $47.5M
The Index Categories
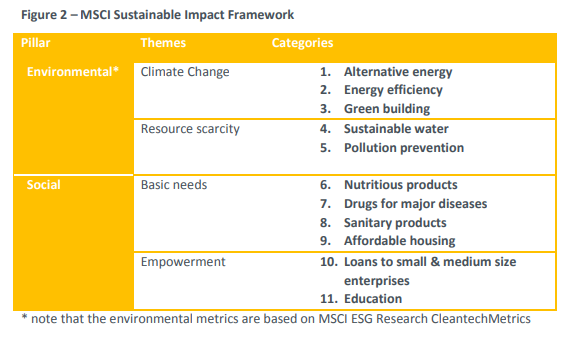
This fund follows the MSCI ACWI Sustainable Impact Index. Here’s a graphic of how the index is supposed to be constructed.
The screen identifies companies that derive sales from products or services that address at least one identified environmental or social challenges.
1. Alternative Energy
This category includes products, services, or infrastructure projects supporting the development or delivery of renewable energy and alternative fuels, including:
- Generation, transmission, and distribution of electricity from renewable sources, including wind, solar, geothermal, biomass, small scale hydro (25 MW), waste energy, and wave tidal.
- Fuels, technology, and infrastructure for the production and distribution of cleaner hybrid fuels, hydrogen, fuel cells, and alternative fuels, including biodiesel, biogas, and cellulosic ethanol. Not eligible under this category: large scale hydroelectric plants (>25 MW installed capacity)
Source: “MSCI ACWI SUSTAINABLE (sic) IMPACT INDEX METHODOLOGY| FEBRUARY 2016”
So for this category a few things popped out. First is that biomass is often not green, it includes things like wood chips and trees. Biomass combustion can actually have higher CO2 emissions than fossil fuels, and are less energy efficient – the reason it is included as a “green” fuel is that it’s “carbon neutral” as plant matter has taken CO2 from the atmosphere and produced oxygen during its life as part of photosynthesis (perhaps also due to big industry lobbying). Biofuels such as biodiesel and cellulosic ethanol would require large land use (10% of fuel for transportation in 2050 would require 30% of all the energy in a year’s worth of crops today), are unsustainable, and can lead to soil erosion, cause water pollution and depletion. Wind energy is very land inefficient, even compared to solar, requiring 10 times the amount of land use.
Nuclear
Notably absent from the alternative energy category is nuclear power. See Yale’s article on why nuclear energy makes sense as a clean source of energy. Nuclear power actually releases less radiation into the environment than coal. It has a very large energy capacity, would require much less land compared to other energy sources used to generate equal amounts of power. It also produces an amount of CO2 emissions compared to solar (that is, during construction, mining, fuel processing, maintenance, and decommissioning), and only produces 4-5% as much as a natural gas plant. Extraction of uranium from coal ash is being explored by China, South Africa and Hungary. It’s safer than solar, there are already solutions for dealing with nuclear waste, and the dangers are widely overestimated by the general public/politicians. No energy source is perfect, but investing in nuclear could essentially provide large amounts of safe low-emission energy.
Yale’s article (the source for most of the following statements, unless otherwise linked) opines that the reason that nuclear is not being explored by politicians and environmentalist groups is fear. The Three Mile Island disaster only resulted in an average radiation exposure of 1/6 of a chest x-ray, and the Chernobyl accident only caused a significant increase in thyroid cancer in children who drank milk contaminated with radioactive Iodine. A full body CT scan exposes you to 10-30mSv, the United Nations Scientific Committee on the Effects of Atomic Radiation (UNSCEAR) concluded that “due to both external and internal exposures, received by members of the general public during 1986-2005 [were] about 30 mSv for the evacuees, 1 mSv for the residents of the former Soviet Union, and 0.3 mSv for the populations of the rest of Europe.” The UNSCEAR Chairman (a physician) was quoted as saying “This rate is lower than the average fatalities from [accidents involving] a majority of other energy sources. For example, the Chernobyl rate is nine times lower than the death rate from liquefied gas… and 47 times lower than from hydroelectric stations.” Nuclear actually causes less deaths than solar power does when measured as deaths/energy unit, “Studies based on World Health Organisation data and other sources found that globally, about 100 people die for each terawatt-hour of electricity produced by coal, 36 from oil, four from natural gas, 0.44 for rooftop solar and 0.04 from nuclear.” Fukushima caused no deaths, and 98% of residents received living near the plant received less than 5mSv, 2/3 received less than the normal yearly limit of 1mSv with only 10 people receiving greater than 10mSv. The issue of nuclear waste disposal is addressed in Yale’s article as a continuing political problem but one that already has technological solutions (90%+ of current US spent fuel can be recycled to provide power for 100 years) and large capacity permanent isolation disposal plants already exist.
2. Energy Efficiency
This category includes products, services, infrastructure, or technologies that proactively address the growing global demand for energy while minimizing effects on the environment, including:
- Technologies and systems that promote efficiency of industrial operations (e.g., turbines, motors, and engines), industrial automation and controls, and optimization systems (e.g., cloud computing, data optimization systems).
- Infrastructure, technology, and systems that increase the efficiency of power management, power distribution, power storage (e.g., batteries), demand-side management (e.g., wireless sensors, advanced meters, smart grid).
- Technologies and systems focused on reducing fuel consumption of transport vehicles and industrial operations (e.g., hybrid/electric vehicles)
- Sustainable transportation infrastructure including urban mass transit, efficiency improvements of public transportation fleets, electric vehicle charging, improved traffic systems.
- Architectural glass, efficient lighting, insulation, building automation and controls, and devices and systems designed to be utilized in the design and construction of environmentally sustainable buildings.
- MSCI ESG Research’s Energy Efficiency category does not include:
- Corporate operational energy efficiency efforts, such as efficiency gains in manufacturing, transporting, or distributing standard products or services.
- Energy efficient components of finished goods
Source: “MSCI ACWI SUSTAINABLE IMPACT INDEX METHODOLOGY| FEBRUARY 2016”
This category’s criteria look much better compared with the issues addressed in the alternative energy category.
3. Sustainable Water
From the index methodology: “This category includes products, services, and projects that attempt to resolve water scarcity and water quality issues, including minimizing and monitoring current water use and demand increases, improving the quality of water supply, and improving the availability and reliability of water.” That includes water infrastructure, water reduction/reusing/recycling technology, and materials, equipment, technology and services that filter or chemically treat waste water.
Not included is water distribution without any improvements to water quality.
This again looks like a well-constructed category, simple and easy to understand. If you’re interested in water stocks check out the Invesco Water Resources Portfolio ETF (PHO), Invesco Global Water ETF (PIO), and the Invesco S&P Global Water Index ETF (CGW), or check out Goose Hollow’s detailed overview of 21 top water stocks.
4. Green Building
This category includes design, construction, redevelopment, retrofitting, or acquisition of ‘green’ certified properties – subject to local green building criteria, including:
- Properties that are certified as ‘green’ based on the local country’s environmental performance standard (eg, based on Energy Star, NABERS >3, or equivalent) or environmental design standards (eg, LEED Certified, BREEAM, or local equivalent).
Source: “MSCI ACWI SUSTAINABLE IMPACT INDEX METHODOLOGY| FEBRUARY 2016”
My concern for this would only be whether redevelopment in order to get certification just for the sake of it might result in even more energy + resources being used for little gain, other than that I have no issues.
5. Polution Prevention
This category includes products, services and projects that support pollution prevention, waste minimization or recycling.
This category includes products, services, or projects that support pollution prevention, waste minimization, or recycling as a means of alleviating the burden of unsustainable waste generation, including:
- Technologies, systems, and projects aiming to reduce air pollution (environmental IT, conventional pollution control systems, CCS)
- Projects to salvage, use, reuse, and recycle post-consumer waste products
- Waste treatment and environmental remediation projects, including land treatment and brownfield cleanup, soil washing, chemical oxidation, and bioremediation
- Sustainable alternative materials including raw materials, paints, adhesives, etc. used primarily in the construction of environmentally sustainable buildings
Not Included: Landfill or incineration waste treatment projects without a specific waste-to-energy component.
Source: “MSCI ACWI SUSTAINABLE IMPACT INDEX METHODOLOGY| FEBRUARY 2016”
So I’m not sure about this one, it looks good to me, but I’m not at all familiar on waste treatment or sustainable building materials. So if anyone who does want to share if there might be any objectionable stocks included due to this category or specific criteria please do so in the comments.
6. Nutritious Products
From the methodology:
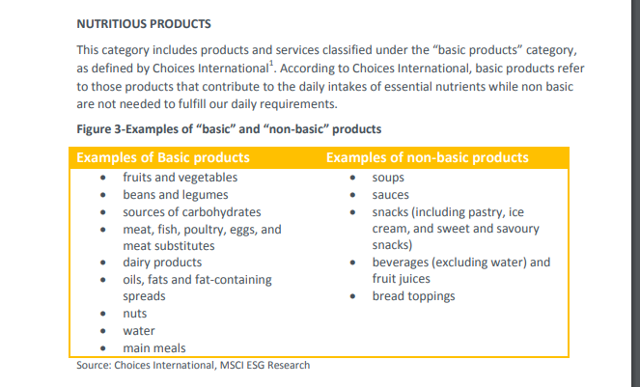
I like that this clearly excludes “non-basic” products like non-water beverages (i.e. not classifying high sugar fruit drinks as “fruits”).
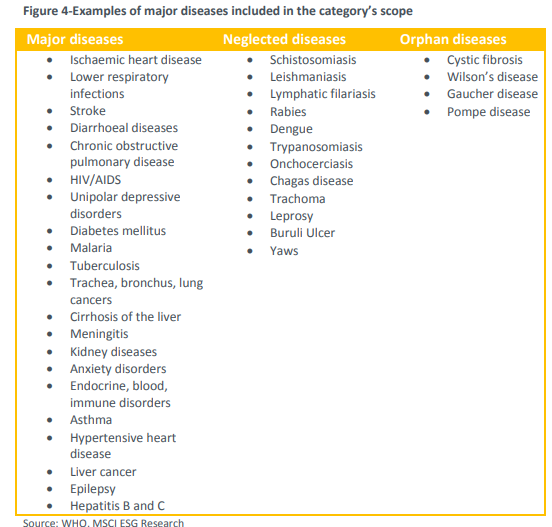
7. Drugs for Major Diseases
This category includes drugs for major diseases as measured by top DALY (a WHO measurement that measures number of years lost due to disease around the world) scores, orphan drugs (uses FDA definition of treatments that treat about 1 in 1500 people) and tropical neglected diseases as indicated by the WHO.
8. Sanitary Products
This category includes products used for basic sanitation.

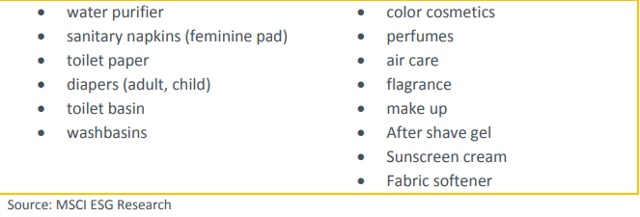
No big objections for me, although it might include soaps which may have environmentally toxic chemicals if not disposed properly.
9. Affordable Housing
From the index’s methodology: “This category includes low income residential and commercial properties. Residential properties take the form of homes for reconstruction efforts, affordable residences for the elderly and units devoted to be managed under social rent or purchased through shared equity or shared ownership. Low income commercial properties include commercial spaces for Small and Medium Enterprises (SMEs).”
So this category looks clearly defined, although “affordable housing” schemes can sometimes be unaffordable for low-income families and should be paired with a strategy to increase the overall supply of housing.
10. Loans to Small and Medium Enterprises
This is literally all the methodology says about this category:

Possible objections are those that would apply to any commercial lender, like how credit worthy the borrower is, how leveraged the lender is, and if it’s able to make enough profits to cover any possible defaults.
11. Education
No details mentioned in methodology document.
The Index Construction
- All companies in the sustainable development universe are contacted by MSCI analysts for verification along with a review of the company’s literature.
- To be included a company must derive 50%+ of its revenue from one or more of the 11 categories mentioned above.
Minimum Standards:
All of the following standards must be maintained:
- “Companies must not have faced ESG controversies as defined by IM score of 0, 1 and 2 respectively” (10 is a perfect score, 0 is worst)
- Less than 10% of revenue from tobacco production
- Less than 10% of revenue from alcohol production
- “Companies must not be involved in predatory lending practices. MSCI ESG Research defines involvement in lending practices as those companies that provide products and services associated with certain controversial lending activities and those companies that have been subject of alleged lending controversies (see appendix for more details on the definition of predatory lending)”
- From the methodology appendix: Predatory lending is defined as the “imposition of unfair and abusive loan terms on borrowers” by engaging in deception, fraud, or manipulation through aggressive sales tactics, and taking unfair advantage of a borrower’s lack of understanding about complicated transactions.
- “Companies must have an ESG Rating greater or equal to BB” (or between 3 and 10 on a 10 points scale)
Companies are weighted based on the percentage of sales from sustainable impact categories, using the following formula (normalized to 100%):
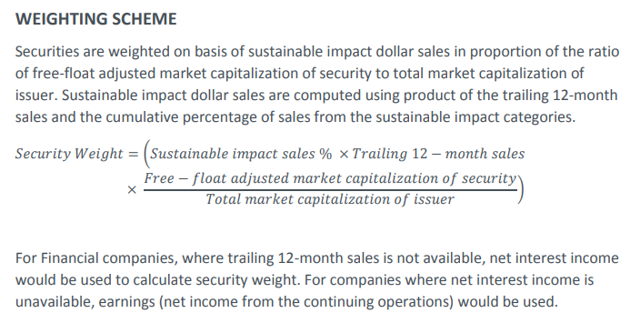
Sector weights are capped at 20% and issuer weights are capped at 4%.
The index is reviewed quarterly to check for eligibility and the sustainable impact sales is reviewed/calculated annually when the index is rebalanced. If there are any controversies with ESG scores, then that stock may be removed if it has an IM Score of 0, 1, or 2.
Here’s what topics are monitored for the ESG IM Scores:
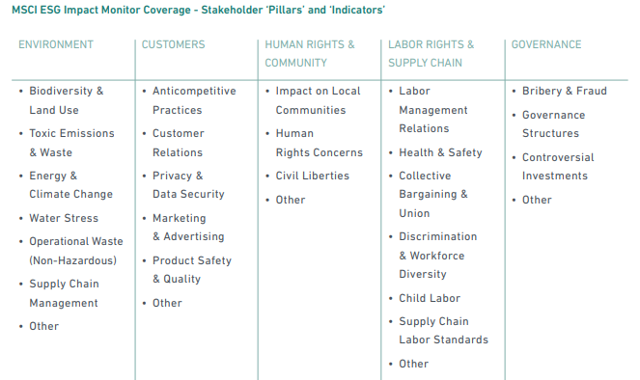
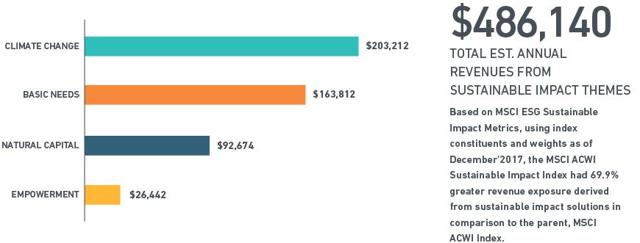
Source: MSCI ACWI Sustainable Development Index
Compared to the parent index, the MSCI ACWI index, this fund has 40% less CO2 emissions measured in tonnes/million in sales at 115 compared to 193 for the ACWI index (according to iShares which offers this ETF and the MSCI ACWI ETF). It also has an improved ESG score at 6.9 compared to 5.7 with the parent index.
Sector Allocation
This completely eliminates its financial services holdings, communication services and energy holdings, with technology (7.3%) being less than half of the benchmark (18.8%). Industrials (19.7%) and healthcare (20.7%) stocks are doubled compared to the benchmark (10.4% and 10.9%, respectively). Consumer defensive stocks are almost triple (23.9% vs. 8.6%) compared to the MSCI ACWI index (the benchmark).
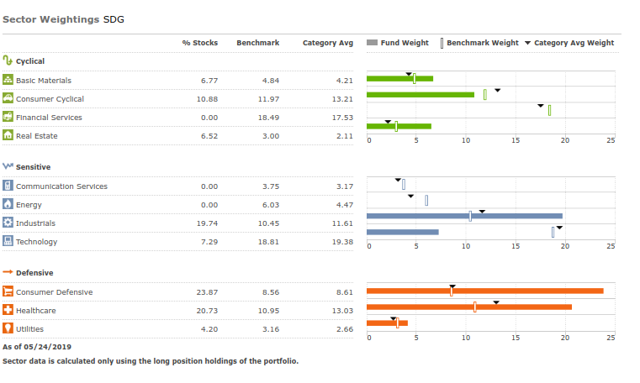
In order to get a backtest of what this portfolio would have looked like, I’ve used PortfolioVisualizer’s (it’s free by the way and it has a lot of cool free tools) backtest tool, using global sector ETFs. Note that US ETFs were substituted for technology and real estate as there weren’t any global ETFs with a long enough history. Portfolio 1 is the model for this fund, using the same sector weights, with Portfolio 2 using the same sector weights as the MSCI ACWI index is currently. Both are rebalanced annually. One caveat is that the backtest assumes that sector weights don’t change over time. The backtest is from January 2007 – April 2019.
Here’s how the fund (portfolio 1) would have performed compared to the benchmark. Of note, the CAGR is about 1% higher at 7.65% vs. 6.59% and the standard deviation is at 14.27% vs. 16.03%.

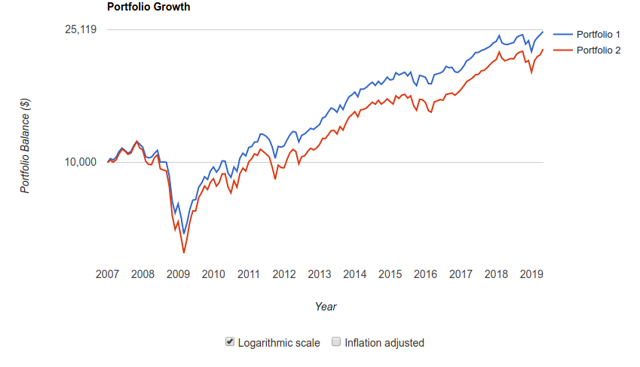
Source: PortfolioVisualizer
For reference, here’s the stats for each of the sector ETFs.

Source: PortfolioVisualizer
What explains the differences in performance? The biggest factor is lack of financial sector holdings, which accounts for 18% of holdings in the benchmark portfolio (portfolio 2), which have had virtually zero returns (0.08% CAGR) since 2017 and have been the worst-performing sector during this time frame.
One interesting tool from the Portfolio Visualizer is a portfolio risk composition analysis tool which measures the percentage of total risk for each stock/fund holding that your portfolio would have. Its largest sectors, consumer staples and healthcare are relative low risk compared to others, so the biggest factor is industrials which makes up a quarter of the risk.

Geographical Allocation
Geography plays a large factor for overall stock returns, so even if your primary goal is to invest in companies that support environmental or social goals, you should look at its geographical holdings breakdown and check how that affects your overall portfolio. This fund is a global fund, with the US, Japan, UK, China, and France being within the top holdings. I’d say it’s fairly diversified with the US containing only 1/3 of its holdings, but if you’re using this fund to replace an ex-US fund, then you should make sure to factor that it will increase your overall exposure to the US.
| Country | Percentage of Holdings |
|
United States |
33.18 |
|
Japan |
13.87 |
|
United Kingdom |
10.79 |
|
China |
8.51 |
|
France |
6.43 |
|
Denmark |
5.57 |
|
Taiwan |
3.38 |
|
Germany |
3.12 |
|
Belgium |
3.05 |
|
Hong Kong |
2.51 |
|
Sweden |
1.69 |
|
Korea (South) |
1.29 |
How does this compare with the overall MSCI ACWI index?
So some interesting observations when using the MSCI ACWI index as a benchmark. North America is heavily underweighted, the fund has 35% in the US with virtually zero in Canada compared with 55% for the US and 3% for Canada in the benchmark. The most likely reason having virtually zero holdings in Canada would be that the Canadian market is mostly financial services and energy stocks which are both lacking in this fund. Other countries like the UK are double overweighted (12.1% vs 5.25%), with Europe Developed being almost double weighted (22.6% vs. 13.7%).
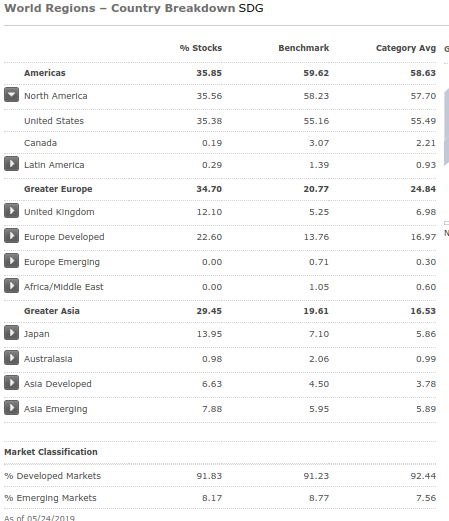
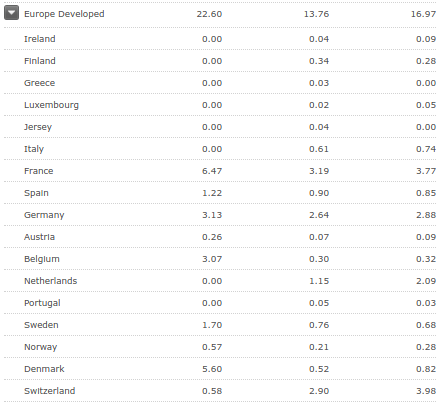
Things that stand out in the Europe Developed category are France (at 6.5% vs. 3.2%), Belgium (3.07% vs. 0.3%) and Denmark (5.6% vs. 0.5%).
Significantly overweight countries in Asia include both China (7.4% vs. 4.0%) and Taiwan (3.4% vs. 1.3%).
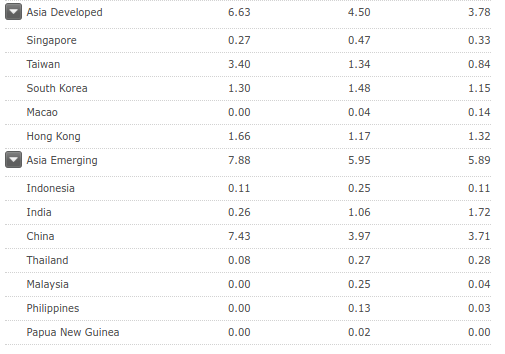
Source: Morningstar
Portfolio Details
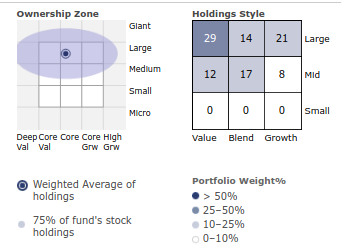
This fund is a mid/large cap fund which according to Morningstar is tilted towards value.
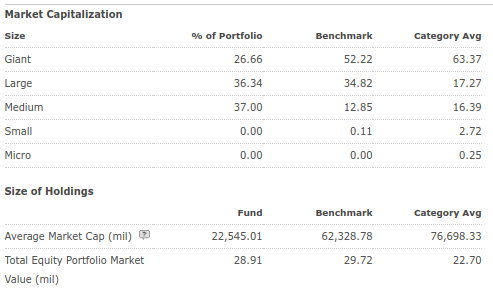
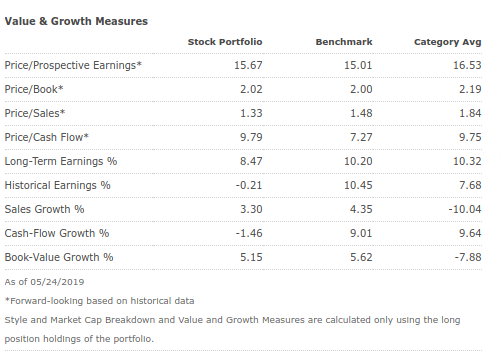
When taking into account valuation ratios, sector weightings and countries of holdings need to be taken into account. This fund does not have financial stocks, communication stocks, or energy stocks which tend to have low P/E ratios.
Expected Valuation Ratios Based on Sectors (Data from Morningstar)
| Sector | Ticker | Weight | P/CF (fwd) | P/E (fwd) | Long-Term Earnings Growth |
| Global Materials | MXI | 6.77% | 7.41 | 13.86 | 9.07% |
| Global Consumer Discretionary | RXI | 10.88% | 10.03 | 17.63 | 10.90% |
| US Real Estate | IYR | 6.52% | 8.2 | 35.23 | 6.26% |
| Global Industrials | EXI | 19.74% | 6.62 | 16.17 | 10.33% |
| US Technology | IYW | 7.29% | 14.57 | 22.14 | 12.13% |
| Global Consumer Staple | KXI | 23.87% | 13.78 | 18.64 | 7.94% |
| Global Healthcare | IXJ | 20.73% | 13.09 | 16.16 | 9.34% |
| Global Utilities | JXI | 4.20% | 7.23 | 17.08 | 6.80% |
| Weighted Average | 10.80 | 18.47 | 9.25% | ||
| Actual for SDG | 9.79 | 15.67 | 8.47% |
I believe that cash flow-based metrics are more useful, as it’s harder to manipulate them. Price/Sales and Price/Book wouldn’t really make sense as different sectors have different margins and capital efficiencies. So in order to better analyse whether you’re getting a ‘good deal,’ you’d have to compare a stock to its peers as different sectors can have entirely different ranges for a ‘good deal.’
What I did in the above table was to get the forward P/E and forward P/CF for each of the funds representing each of the sector the fund holds. They were the same ones used in the Portfolio Visualizer backtest. I then calculated an average weighted by the weight of each sector.
This analysis does not take into account growth rates, which are one input in stock valuation. So without growth rates, the weighted average by sector P/CF is 10.80 vs. the actual of 9.79, and the weighted average by sector P/E is 18.87 vs. the actual of 15.67. Looking at those numbers suggests that this ETF is slightly tilted towards value.
I’ve also calculated the weighted average by sector projected long-term earnings growth rate, the projected data for the fund’s holdings is about 9% less than what my constructed weighted average suggests or about 0.78pp less per year. So higher expected growth rates typically justify higher ratios. If you adjust the weighted average, by let’s say reducing it by 9%, that comes up with a weighted P/CF of ~9.8 (about the same as the actual P/CF for the fund) and a P/E of ~16.6 (the fund has a lower value at 15.67); this means that this fund is either slightly titled to value or about the same as my constructed benchmark where both portfolios have the same sector weights.
Final Thoughts
Would I buy this ETF? Its 0.49% expense ratio is much higher than regular beta ETFs like iShares MSCI ACWI ETF (ACWI) which has an expense ratio of 0.32% or other world ETFs like the Vanguard Total World Stock ETF (VT) which only has an expense ratio of 0.1%. This would be fine if its strategy is based on financial quantitative factors or other factors that could result in the potential for higher returns, lower risk, or at least a better (financial) quality portfolio.
Overall, this fund is based on an index that clearly defines how it implements the UN’s sustainable development high-level goals apart from the alternative energy category (although not regarding nuclear as “green” and regarding biomass as “green” is pretty standard in government). It provides a geographically diversified fund across many sectors and has reasonable valuation ratios. If you agree with how this ETF is constructed, or only feel that the concerns about the alternative energy category I raised are minor or otherwise wouldn’t affect your investment decision and feel that it’s worth paying 0.49%, then go ahead. I personally feel that its inclusion of biofuels and exclusion of nuclear aren’t in line with “clean energy,” so I would not invest in it based on that and because social quality does not necessarily mean financial quality.
My favourite ETFs are the Alpha Architect’s (it is a quant firm) funds which are headed by CEO Dr. Wesley Gray, particularly the quant value ones (see my article on them). It has some rather insightful stuff on its blog where it summarizes academic research or its own models (am not connected to it in any way, just really like its stuff). I read through his book “Quantitative Value” recently and it’s definitely one I would recommend. Perhaps if you essentially combined a social responsibility strategy with Gray’s quant strategy, then it might be something I’d consider.
Author’s Note: If you enjoyed this article and wish to receive updates on my future articles, please click “Follow” next to my name at the top of this article. Please don’t hesitate to leave feedback, comments, suggestions and ideas for future articles.
Disclosure: I/we have no positions in any stocks mentioned, and no plans to initiate any positions within the next 72 hours. I wrote this article myself, and it expresses my own opinions. I am not receiving compensation for it (other than from Seeking Alpha). I have no business relationship with any company whose stock is mentioned in this article.
[ad_2]
Source link Google News

