[ad_1]
Rising gas prices reflect a dramatic oil price shock. PondShots/iStock via Getty Images
The recent jump in crude oil prices has triggered concerns about the implications for stock market performance. It would make sense that higher oil prices would lead to higher production costs, reduced supply, and decreased consumer demand, thereby lowering economic growth and companies’ future prospects, which, in turn, would cause stock prices to fall.
From an investment perspective this analysis is meant to prepare you for what might occur because of a future oil price shock: a declining market. Although the current oil shock has passed, it is possible another will occur during the Russia-Ukraine war or during the aftermath, depending on the outcome. Oil price shocks happen quickly, so to prepare your portfolio you must forecast a shock and respond before the shock occurs. However, given most oil price shocks are, like the recent one, quick, this can be a risky strategy. The good news, as you shall see, is the market reverses itself as an oil price shock dissipates.
To understand this phenomenon and to conjecture about the future, I analyzed statistically the historical record of the relationship between the stock market and oil price shocks. The statistics indicated that when we take account for monetary policy, there is no relationship between changes in oil prices and market returns. In other words, what looks like a market response to oil price changes is actually a response to changes in monetary policy. However, since 1970s the U.S. has only had five oil price shocks, including the current one. Typically, the spike in oil prices is quick, as are the market’s reactions. Given that we have had so few oil price shocks, and the effect is so brief, it is not surprising that simple time series models cannot find statistically meaningful results.
Because of this, I closely examined each of the oil price shocks within a brief time span around the shock and I was able to see a market response. My assessments show that the average oil price shock was an increase in price of 127% over 11 months corresponding with a fall in the market of 23%. There is no clear pattern between the degree to which oil prices rise and the stock market falls in response.
Economically, other things happened before and during these oil price shocks that we need to consider so we can understand other probable causes of the stock market response. The main factors that I considered were fiscal and monetary policies. The impact of these other factors is what makes it is difficult to unravel exactly to what degree oil prices versus other factors caused a stock market response. None of these issues, however, limit us from seeing that the market does respond to shocks.
To help you understand the relationship between oil price shocks and the stock market’s response, I present charts of movements in the S&P 500 (NYSEARCA:SPY) overlayed with oil price movements during the periods around the five oil price spikes. These charts show declining market returns in conjunction with an oil price shock in all examples except one. What you will not see are the other causal events surrounding these events, which I discuss to help put things in perspective.
Five Oil Price Shocks
I examined the Arab oil embargo that occurred in 1973-1974, the energy crisis of 1979, the oil price jump caused by Iraq invading Kuwait in 1990, the oil price rise in 2007 caused by China’s rising global demand, and the current shock caused by the Russia-Ukraine war.
In my analysis, I use the price of West Texas Intermediate crude oil because it is the only series with historical data available back to the 1970s. The correlation between the West Texas prices and the prices of Brent crude oil, which is the usual price metric used today, is extremely high; therefore, there is no loss of understanding because of the this. See this Seeking Alpha article for a discussion of the difference between the two prices. I measure the stock market’s response to oil price shocks using the S&P 500 Index, which is a common and fair indicator of the stock market’s performance.
Arab Oil Embargo
Because of the U.S. support for Israel during the Yom Kippur War, the Organization of Arab Petroleum Export Countries, OAPEC, instituted an oil embargo against the U.S. in October 1973, which they lifted in March 1974. At that time, OAPEC produced 36% of the global oil supply. The embargo was short, but during that time the price of oil jumped 159% and the S&P 500 fell 41%.
In Chart I presented below, I plot the S&P 500 Index along with the oil price for the period surrounding the embargo. Two observations from the chart: first, the S&P had already fallen before the embargo started and, second, the price of oil continued to rise past the ending of the embargo.
Federal Reserve Bank of St. Louis; Center for Research in Stock Prices, CRSP; NBER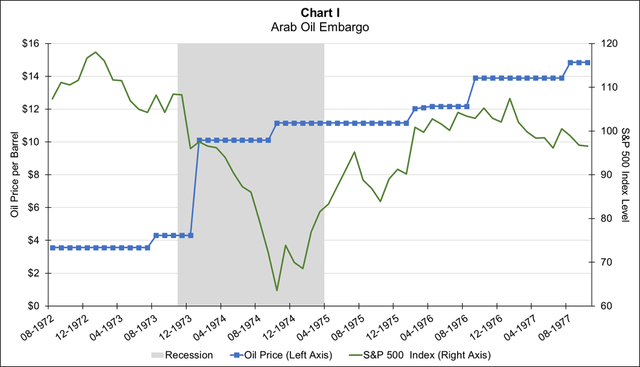
The Arab embargo had a large impact on the U.S., which lost around 6% of its oil supply because of the embargo. This led to shortages of oil products for U.S. consumers, causing a lot of consternation and long lines at gas stations. The effect of the embargo lasted long past its conclusion, with OPEC keeping the price of oil permanently higher, and thereby altering the path of global consumption through today.
This oil price shock occurred simultaneously with the 1973-1975 recession. The Fed caused this recession because of its strong contractionary monetary policies put in place in early 1972. These policies tripled the fed funds rate going into the recession. The fed funds rate is the interest rate charged between banks for lending and borrowing between each other overnight and is the main policy variable the Fed uses to control monetary policy. The Fed backed off its contractionary policies in the middle of the recession, to which the market responded with a delay, before rising again. Furthermore, despite the tight monetary policies, this period had high inflation, which rose to a high of 12.1% during the recession.
Tight monetary policy was the reason why the S&P 500 began declining prior to the embargo. The oil shock then compounded this decline. Once the Fed loosened its policies after the initial oil price jump, the market climbed back up. Since part of the stock market’s movements during the oil price jump was in response to monetary policy, it is not obvious how much of the market decline was because of the embargo relative to monetary policy.
Iranian Revolution
The Iranian Revolution started in January of 1978 and ended in February 1979 with the defeat of the Iranian monarchy. The price of oil immediately jumped because of rapid reductions in Iranian oil production, which had produced 8.7% of the global supply. This sparked the energy crisis of 1979. As you can see in Chart II, between January 1979 and the price peak in April 1980, oil prices rose 166%. During this period, the S&P 500 did not decline; rather it rose by 6%.
Federal Reserve Bank of St. Louis; Center for Research in Stock Prices, CRSP; NBER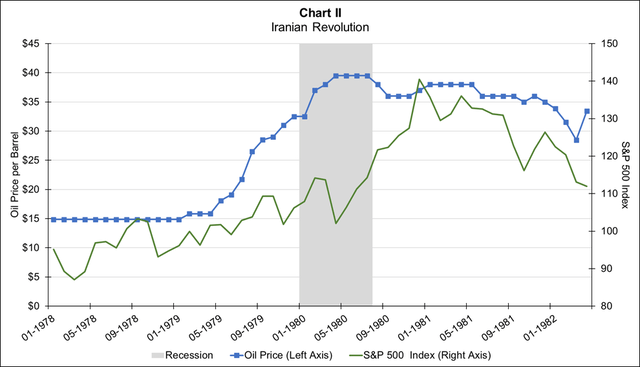
As with the Arab embargo, the 1979 shock also dramatically affected the U.S., as well as many countries around the world. The decline in Iranian production reduced global output by 3.3% in 1980 and 2.5% in 1981 and was one of the reasons the U.S.’s imports of crude oil fell by 33% during this period. The drop in the U.S.’s supply of oil during this period created rationing for consumers at the pump.
Because of high inflation, during this time the Fed enacted contractionary monetary policies, with the fed funds rate almost tripling going into the recession, before declining briefly in the middle of it. These monetary policies led to slower economic growth and the 1980 recession. Despite these policies, inflation remained high during this period, averaging 11% during the period shown in chart. The Fed relaxed its tight policies briefly during the recession because of the rising oil prices. Again, it is difficult to separate out the effects of monetary policy and spiking oil prices.
Because of the high inflation rate during this period, I reexamined the market’s response in real terms, by adjusting all the numbers for inflation. In inflation-adjusted real terms, the stock market declined 10% because of the oil price increases. Moreover, the real S&P 500 level started falling in early 1977 and continued to fall after the oil price shock, while in nominal terms the stock market started to climb in early 1978 and continued to rise after the oil price shock. Quite different pictures of the same events, with the real numbers better reflecting what was happening.
Iraq Invasion of Kuwait
Iraq invaded Kuwait on August 2, 1990, and immediately oil prices doubled because of expectations for a decrease in global production. You can see the resulting oil price jump in Chart III, which shows the price of oil rising rapidly after the invasion, to a peak gain of 93%, and then falling back just as quickly. The S&P 500 clearly responded to the oil shock, falling 15%. After the brief market dip during the shock, the market continued its upward climb.
Federal Reserve Bank of St. Louis; Center for Research in Stock Prices, CRSP; NBER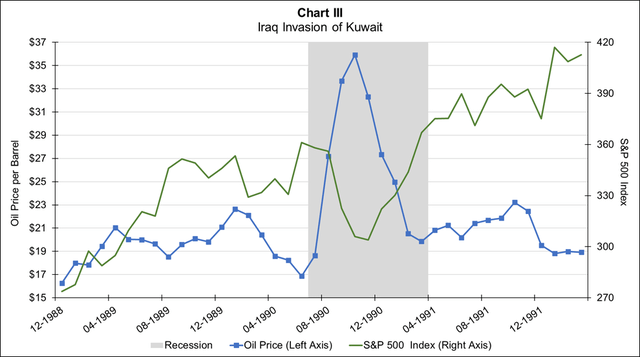
The Iraq invasion of Kuwait reduced global production by an estimated 4.5% in 1990. Nevertheless, this oil price shock was short and quick because, in response to the invasion, OPEC nations immediately increased their production to replace the lost crude within two months. Unlike most of the other examples, prior to the oil shock the Fed had expansionary monetary policies, causing the fed funds rate to fall, which supported a rising stock market prior to the oil price shock. This response of the S&P 500 to the shock is the cleanest example of the five episodes, because the other factors revolving around this shock had minimal effect on the market’s decline.
The Rise of China
In the early 2000s, oil prices started rising because of increasing global demand for oil. Between 2000 and 2007 China increased its global demand for oil by almost 66%, with its consumption rising to 9% of global demand. This rising demand was coupled with no extra growth in the supply of oil, with global oil production continuing is growth rate of around 1.5% per annum during this period. This rising demand and lack of supply growth pushed up oil prices during the 2000s, with oil prices rising 250% from 2000 to 2007. In 2007 these supply and demand forces reached their limit and forced the price of oil to jump.
In Chart IV you can see that between January 2007 and June 2008, oil prices jumped 145%, with the price reaching its all-time high in June 2008. After reaching its peak, oil prices fell immediately, such that by six months later, prices had declined more than threefold. Although the S&P 500 was rising initially when oil prices started to spike, the stock index ultimately felt the pressure of surging oil prices; the S&P 500 reversed and fell 53%, even as oil prices collapsed.
Federal Reserve Bank of St. Louis; Center for Research in Stock Prices, CRSP; NBER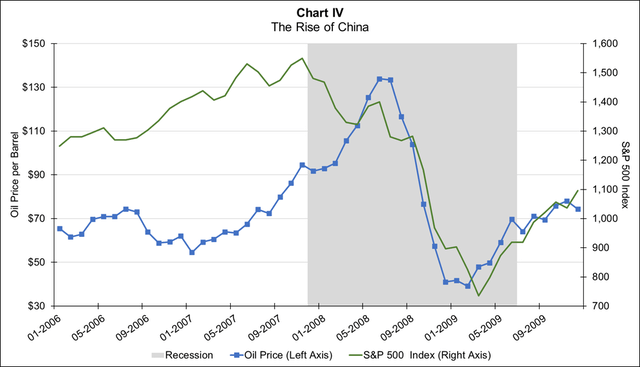
To put these oil price movements into perspective, concurrent with the financial crisis, oil prices peaked in June 2008, between when Bear Stearns collapsed in March 2008 and when Lehman Brothers went bankrupt in September 2008. The large stock market decline during this period was disproportionate to the rise in oil prices because the market was also responding to deteriorating financial conditions. So, we are left with the question: what amount of decline in the S&P 500 was because of the financial crises versus the oil price shock?
Russia-Ukraine War
In preparation for its invasion of Ukraine to annex the country, Russia started building up troops in October 2021 and then invaded in early February. Consequently, the U.S. and its European and Asian allies imposed financial sanctions on Russia in mid-February and then the U.S. imposed import restrictions on Russian oil into the U.S. at the end of February. Since Russia produces 13.1% of the global oil supply, oil prices jumped in response to these actions.
As you can see in Chart V, the Russia-Ukraine war temporarily pushed up the price of oil by 74% between December 1 and March 8, while the S&P 500 fell 12% at its lowest level. Note that, so we can see the actual oil price shock, the last two data points in Chart V both occur in March.
Federal Reserve Bank of St. Louis; Center for Research in Stock Prices, CRSP; NBER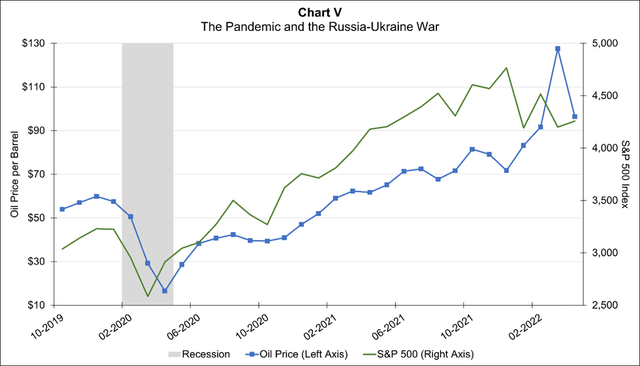
Because expansionary fiscal and monetary policies have been in place due to the pandemic, the market conditions leading up to the oil price spike were different than all the previous episodes, except for the 1990s oil price shock. These expansionary policies have helped the U.S. economy to grow rapidly since the bottom of the most recent recession, with 5.6% real growth in 2021. An unfortunate consequence of these policies, as well as other factors, is that inflation spiraled higher, hitting 7.9% in February. Because of the high rate of inflation, the Fed announced in December that it would put contractionary monetary policies in place early this year.
Therefore, surrounding this oil shock have been expectations that the Federal Reserve was going to increase their key interest rate (which they did), which has also affected the stock market and initially caused the market to fall. Nevertheless, it is clear that the Russian-Ukraine war impacted the decline in the S&P 500, regardless of the additional impacts of these other economic issues. Although, just as with the other examples, we cannot disentangle what percentage of the recent market decline is due to the oil price change versus the expectation of the recent change in monetary policy.
The current quick up and down movement in the oil price was the fastest of all the shocks studied and the stock market response relative to the size of the oil price jump is smaller than the other examples, ignoring the Iranian Revolution. These facts indicate that there was not actually an oil supply disturbance to global markets because of the Russia-Ukraine war. Rather, they indicate that the current sanctions against Russia are not affecting its ability to export oil and the market’s initial expectations of a reduction in supply were incorrect. This is why the price of oil has quickly adjusted back. Therefore, the recent decline in the S&P 500 specifically due to the war has already resolved itself, although, the change in the Federal Reserve’s interest rate policy may or may not override that.
Your Portfolio
The results of my analysis indicate that the S&P 500 does, more often than not, decline when there is an oil price shock. However, the magnitude of the market’s response relative to the size of the oil price increase does not show a pattern. The largest oil shock was due to the Iranian Revolution, when oil prices climbed 166% and the stock market, strangely enough, climbed by 6% (but declined 10% in real terms). The smallest shock is the current one, when the price of oil jumped 74% and the market declined by 12%. The largest market response was the rising China shock, when oil prices rose by 145% and the stock market fell by 53%.
The reason we see varying degrees of market responses to changes in oil prices is other intervening economic factors. For four out of the five oil price shocks studied, contractionary monetary policies or an expectation of them, preceded the oil price shock; only the 1990s recession was not impacted by these policies. Such policies usually cause the market to fall, so the market response to only oil price shocks will be smaller than we observe. Controlling for this, the historical evidence still indicates the stock market moves downward because of oil price shocks and this response is very temporary.
Three out of the five oil price shocks studied were short lived, up and down in short order. For these instances, to prepare your portfolio, you must forecast a shock and respond before the shock occurs, as well as respond quickly when the situation reverses itself. It is not obvious to me that this is a wise strategy compared to just waiting the shock out, given they are short lived. We saw this during the recent shock when some recommended investing in oil stocks and ETFs going into the shock, which was painful on the other side of the shock.
However, if there is a permanent effect on prices, supply, or demand, then you might consider shifting your portfolio into or out of stocks that benefit or lose from such shifts. For example, permanent oil price increases will in the short run benefit the oil sector but in the long run will benefit alternative energies.
The good news from the examples studied is that the market rebounds after its decline, conditioned on having no other intervening factors. Considering the market’s reaction to the recent oil shock, the past evidence indicates the current market decline due to the shock is already over. However, other factors might mitigate a market reversal, such as the uncertainty raised by the war.
[ad_2]
Source links Google News

