
[ad_1]
wsmahar
(This article was co-produced with Hoya Capital Real Estate)
Introduction
This is the second in my bond series of articles examining different ETFs available based on factors such as maturity, risk, and/or issuer type. The first one (SHYG Vs. HYG: Stay Short Unless You Believe Rates Have Peaked) compared the maturity effect on High-Yield Corporate bonds. This article goes to the other extreme on the credit-risk scale but keeps the short/long maturity difference of the first article.
The BlackRock iShares bond series has 22 ETFs, including some with shorter maturities, and includes ones with iBonds that mature from 2022 thru 2032. Of the multiple iShares bond ETFs, here I will examine the iShares 1-3 Year Treasury Bond ETF (NASDAQ:SHY) and the iShares 20+ Year Treasury Bond ETF (NASDAQ:TLT). I will include two more in parts of the ETF comparison section of this article.
iShares 1-3 Year Treasury Bond ETF review
Seeking Alpha describes this ETF as:
The fund invests in U.S. dollar denominated fixed rate U.S. treasury securities that have a remaining maturity of greater than or equal to one year and less than three years. It seeks to track the performance of the ICE U.S. Treasury 1-3 Year Bond Index. The underlying index measures the performance of public obligations of the U.S. Treasury that have a remaining maturity of greater than or equal to one year and less than three years. SHY started in 2002.
Source: seekingalpha.com SHY
SHY has $26.4b in AUM and carries a fee of 15bps. The SEC yield is 2.98%. As with any ETF who passively invests based on an index, studying its methodology should be done. The index manager provides this background.
The ICE U.S. Treasury 1-3 Year Bond Index is part of a series of indices intended to assess the U.S. Treasury market. The Index is market value weighted and is designed to measure the performance of U.S. dollar-denominated, fixed rate securities with minimum term to maturity greater than one year and less than or equal to three years. The ICE U.S. Treasury Bond Index SeriesTM has an inception date of December 31, 2015. Index history is available back to December 31, 2004.
Source: theice.com Index
A summary of the methodology used was also provided:
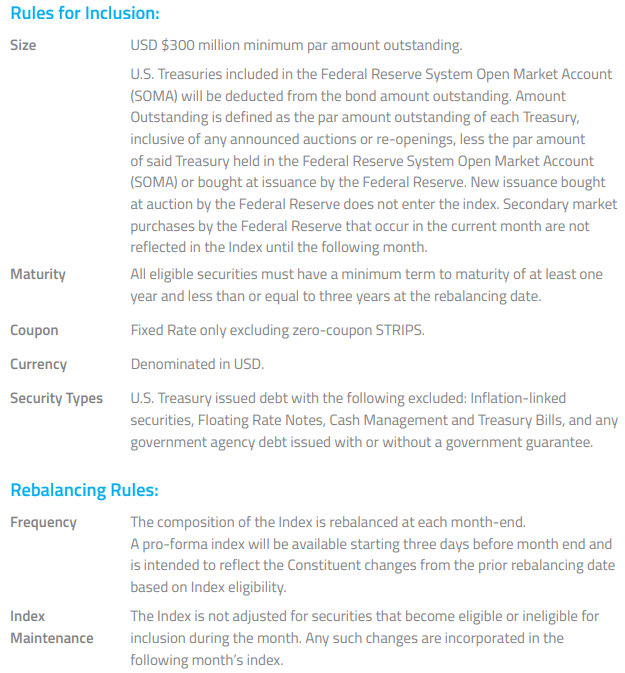
www.theice.com Index
SHY holdings review
iShares provides some basic data about the portfolio.
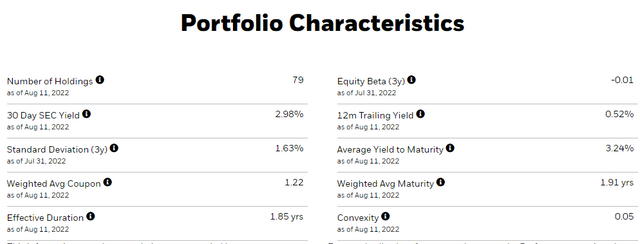
ishares.com SHY
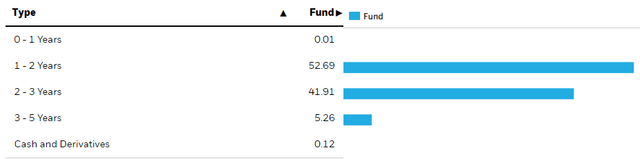
ishares.com SHY maturities
As expected, based on the index used, almost all holdings mature between 1-3 years. Being an UST ETF, I didn’t see the need to include credit rating nor sector data.
Top 20 holdings
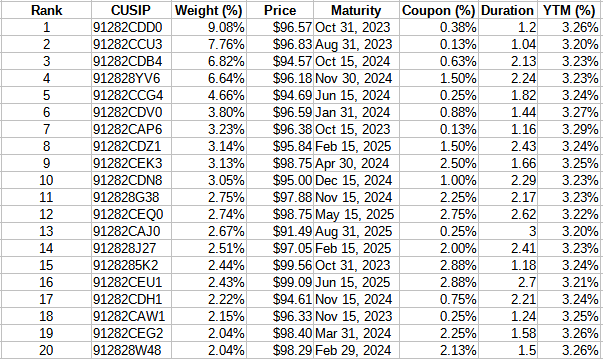
ishares.com SHY; compiled by Author
With only 79 bonds held, the Top 20 represent 75% of the portfolio. The weighted average bond price is currently $96.57. Due to index rules, the two largest holdings, equaling almost 17% of the portfolio, will roll off by the end of August and October of 2022. The 2027 replacements both yield near 3% today, boosting SHY’s income stream when the mandated change is completed.
SHY distribution review
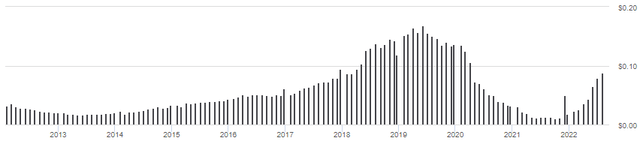
seekingalpha.com SHY DVDs
As expected, the payout adjusts to the changes in interest rates rapidly, one advantage (or disadvantage) of an allocation to the short duration USTs. This payout pattern doesn’t score well within the Seeking Alpha dividend grading system, earning SHY a “D-“.
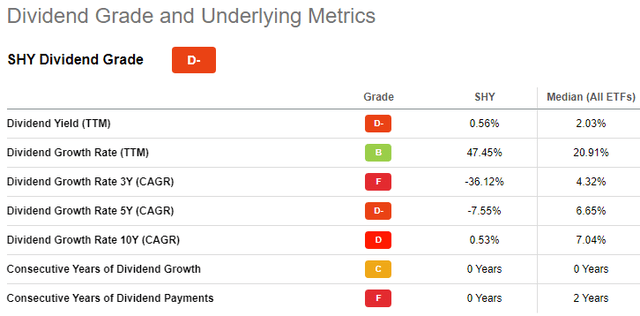
seekingalpha.com SHY scorecard
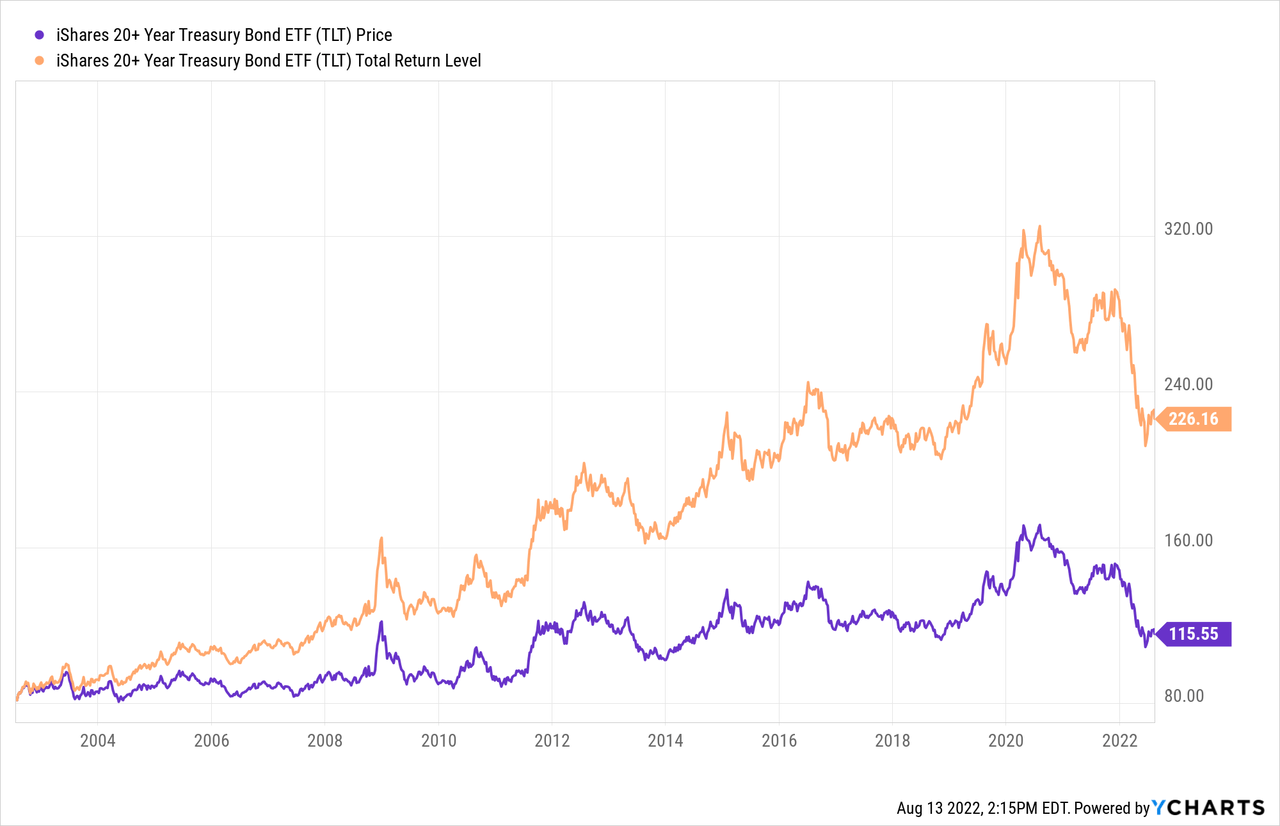
iShares 20+ Year Treasury Bond ETF review
Seeking Alpha describes this ETF as:
The fund invests in U.S. dollar denominated fixed rate U.S. treasury securities with remaining maturity of greater than or equal to twenty years. It seeks to track the performance of the ICE U.S. Treasury 20+ Year Bond Index. The underlying index measures the performance of public obligations of the U.S. Treasury that have a remaining maturity greater than or equal to twenty years. TLT started in 2002.
Source: seekingalpha.com TLT
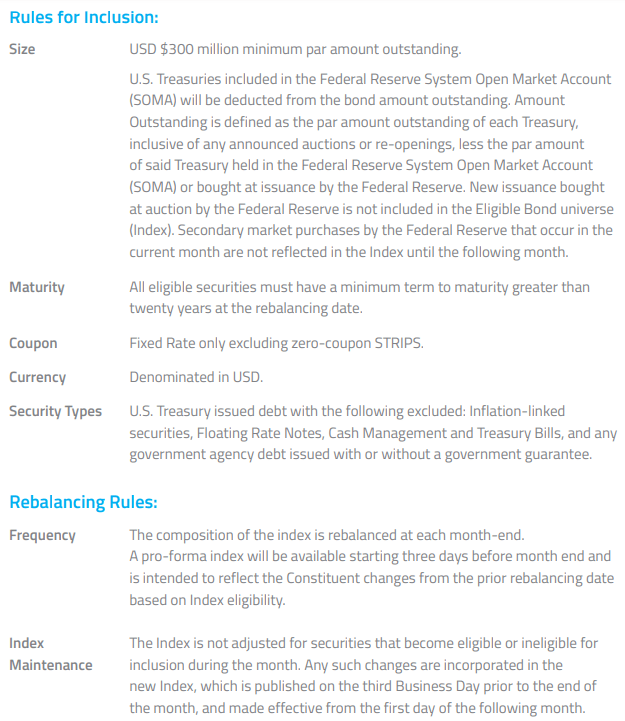
TLT has $25.2b in AUM, with 15bps also in fees. Despite the longer maturities, the SEC yield is 3.13%. The same firm manages the index for TLT as for SHY. Here is the overview and methodology for this index.
The ICE U.S. Treasury 20+ Year Bond Index is part of a series of indices intended to the assess U.S. Treasury market. The Index is market value weighted and is designed to measure the performance of U.S. dollar-denominated, fixed rate securities with minimum term to maturity greater than twenty years. The ICE U.S. Treasury Bond Index SeriesTM has an inception date of December 31, 2015. Index history is available back to December 31, 2004.
Source: theice.com Index
theice.com Index
TLT holdings review
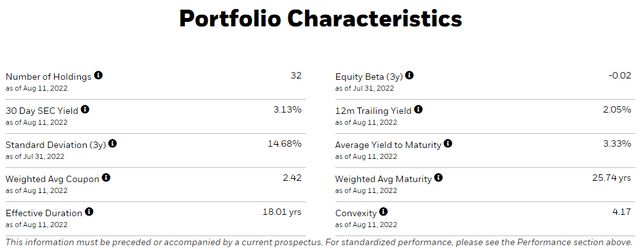
ishares.com TLT
TLT has stayed within its index rules, holding only UST maturing after 20 years.
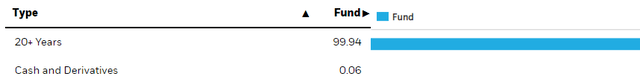
ishares.com TLT maturities
Using the holdings data provided, I was able to break down the holdings by maturity year.
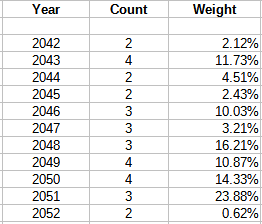
ishares.com TLT; compiled by Author
It is interesting that the weight is not evenly spread across the time periods. I suspect that is related to the level of new issues for each year.
Top 20 holdings
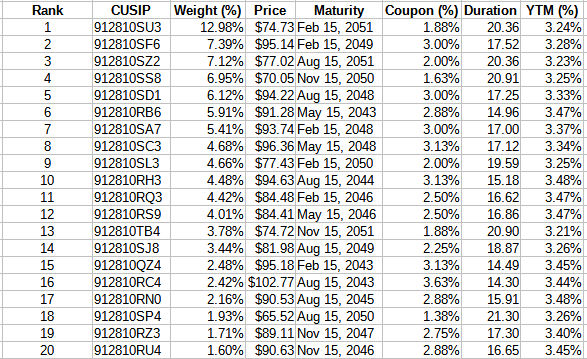
ishares.com; compiled by Author
Having only 32 bonds, the Top 20 are 94% of the portfolio. With longer maturity dates, the average bond price is lower than for SHY at $85.11.
TLT distribution review
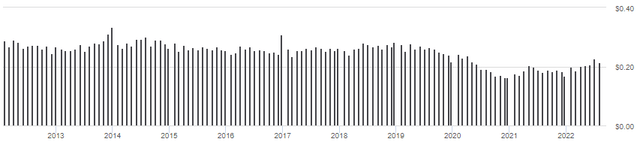
seekingalpha.com TLT DVDs
While there are also payout fluctuations with TLT, they are muted compared to SHY, and this would be expected with the longer maturities used. TLT will need to sell the 2042 bonds by year-end and most likely replace them with 2052 or 2053, which currently aren’t available. Unlike SHY, TLT’s index required change might impact the ETF’s earnings as the current yield on the 2052s is less than what the 2042s yield, slightly.
Seeking Alpha’s dividend grade is only a notch better at a “D”.
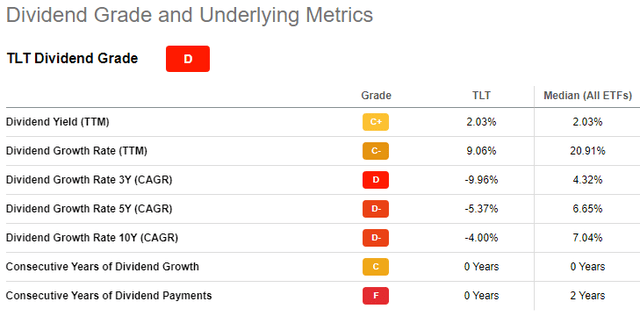
seekingalpha.com TLT scorecard
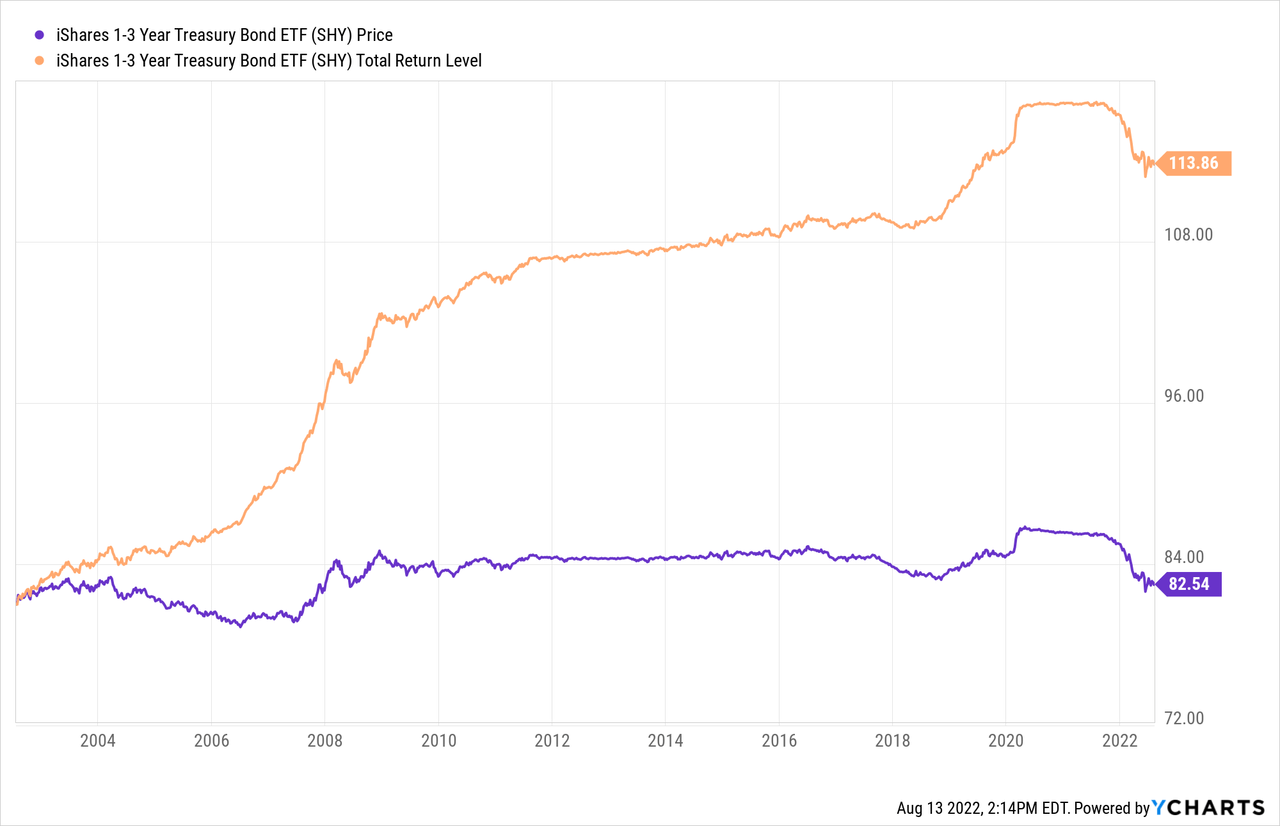
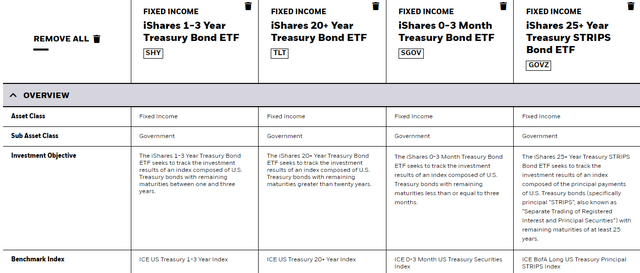
Comparing ETFs
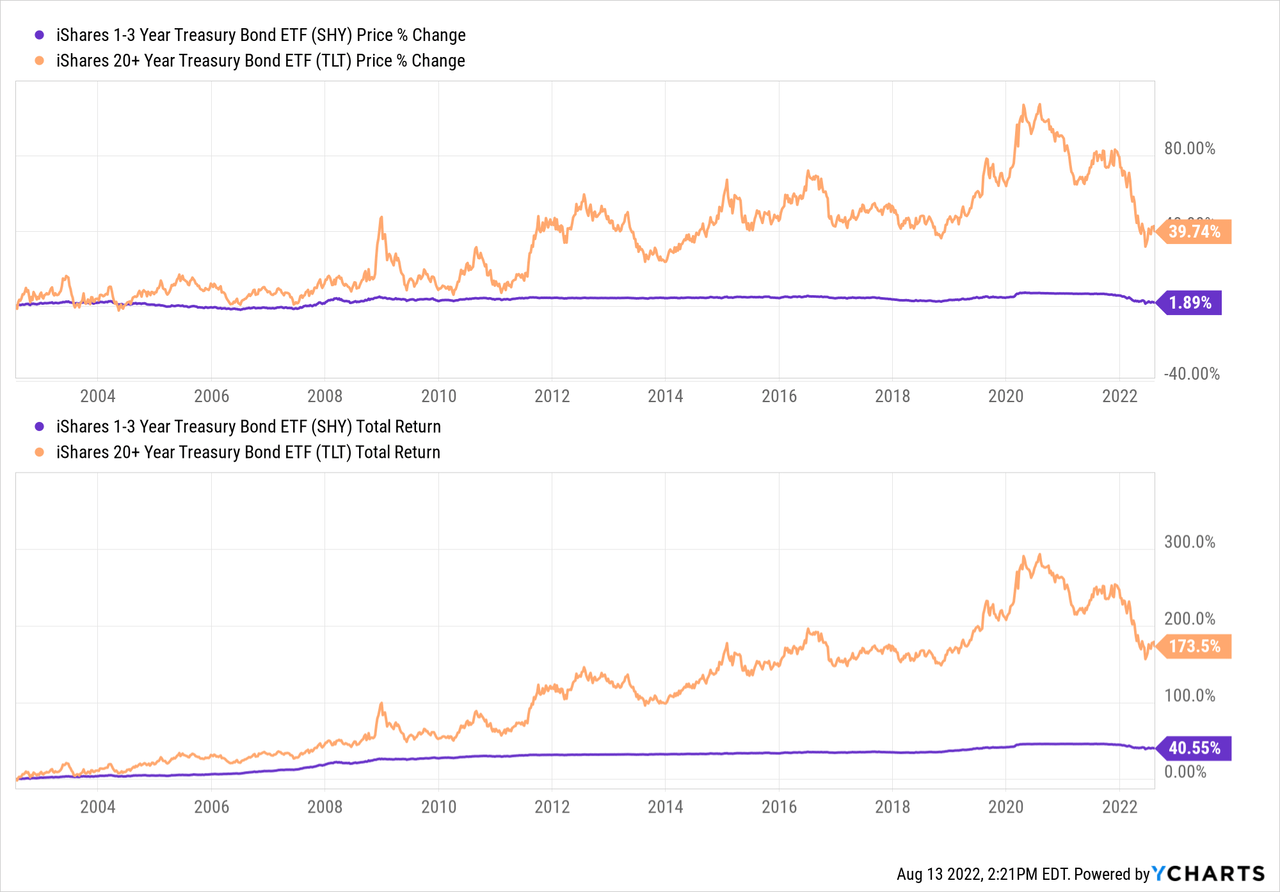
The above charts clearly show investors can own TLT and get extra yield/returns, but at the “cost” of much greater uncertainty: a clear example of why owning a fund based on your expected time horizon is a critical consideration. The two new ETFs I will add now are very new, which is why they were not included in the above price/return charts.
- iShares 0-3 Month Treasury Bond ETF (SGOV): started May 2020
- iShares 25+ Year Treasury Strips Bond ETF (GOVZ): started Sept 2020
For those unfamiliar with STRIPS, here is a definition.
ishares.com ETF compare
| Factor | SHY | TLT | SGOV | GOVZ |
| SEC Yield | 2.98% | 3.13% | 1.75% | 2.95% |
| Duration (yrs) | 1.85 | 18.61 | .08 | 26.89 |
| WAM (yrs) | 1.91 | 25.74 | .09 | 27.32 |
| WAC | 1.22% | 2.42% | 1.77% | 0.00% |
| # bonds | 79 | 32 | 2 | 16 |
Return data thru the end of July was:
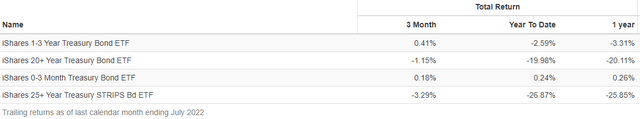
PortfolioVisualizer.com
Return and risk data back to October 2020 was:
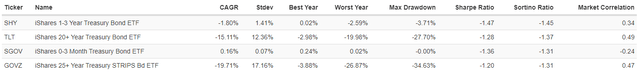
PortfolioVisualizer.com
Both sets of return data match what I would expect for each ETF during a period when interest rates were level than climbing.
Portfolio strategy
With 22 UST ETFs from iShares alone, there has to be one that fits any investor’s need if US Treasuries is the desired asset class. But even within this supposedly non-existent credit-risk category, there are other considerations, thus questions investors need to ask that would decide which of these, or of the other 18 iShares UST ETFs, best match their investment goals. Some of those questions could be:
- Where are interest rates going? Stay short when rising; longer if falling.
- No plans on selling and/or need income. Remember that USTs yield less than riskier bonds, and under normal circumstances, longer maturities usually yield more than shorter ones. As of last March, this is how the yield curves appeared for three bond classes.
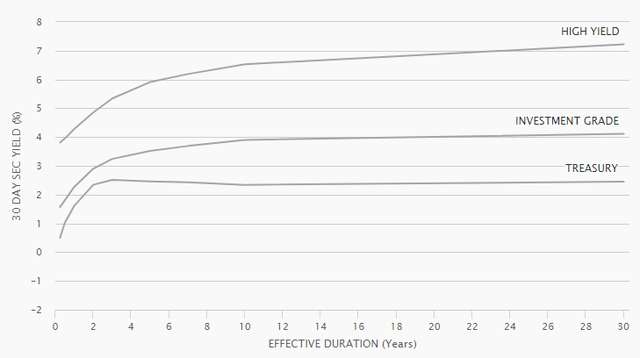
ishares.com Yield curves
- Have risky assets, looking for fund to dampen my portfolio’s risk level. If this is a major goal, using a short-duration UST ETF is a popular choice. There are long/short funds, but deeper research is needed to understand the strategy they employ for risk-reduced returns.
Final thought
For those wanting inflation protection, TIPS is one choice. I recently reviewed two in this article: TDTT Vs. TIP: Duration Matters With TIPS ETFs Too.
[ad_2]
Source links Google News