[ad_1]
da-kuk/E+ via Getty Images
This article was first released to Systematic Income subscribers and free trials on Mar. 17
Recent weakness in stocks alongside elevated volatility has made covered call funds relatively attractive. In this article, we revisit the Russell 2000 Covered Call ETF (BATS:RYLD), trading at an 11.57% yield, that we highlighted last year which has strongly outperformed equity indices as well as most other covered call funds. We also touch on some of the decision points for investors considering allocating to ETFs or CEFs in the sector. For an overview of the dynamics of covered call funds check out our deep dive here.
The Big Picture
There are two key market factors which make covered call attractive allocations at present.
First, implied volatility remains elevated relative to the last 5 years and longer as shown below.
Systematic Income Tools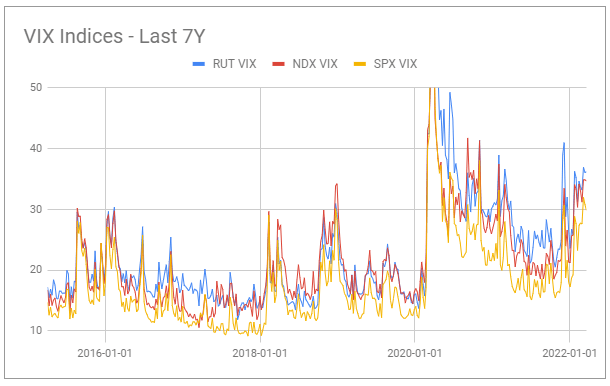
Higher volatility means the price of calls which covered call funds sell is higher, allowing funds to generate a higher level of income. To illustrate the impact of higher volatility, let’s compare the price of the same call option on SPY at the current level of implied volatility of around 30% versus a historic level of around 12%. A 1-month near at-the-money call on SPY bears a premium of around $10 or 2.3% of the current index level. At an implied volatility level of 12%, the same call costs around $5.4 or about half. In short, the effective yield of covered call funds has risen significantly over the last few years.
Second, implied volatility also remains unusually high relative to credit spreads. Despite credit and equities being two different asset classes, there is a direct conceptual relationship between the two via something called the Merton model which is a way to estimate the default risk of a given company via its equity volatility. In short, equity volatility, just like credit spreads, is another way to gauge the default risk of a given company. It is no surprise then that, empirically, credit spreads and equity volatility have a strong historic relationship. More recently, however, this relationship has broken down somewhat. Depending on how you look at it credit spreads are either too low relative to equity volatility or equity volatility is too high relative to credit spreads as shown below.
FT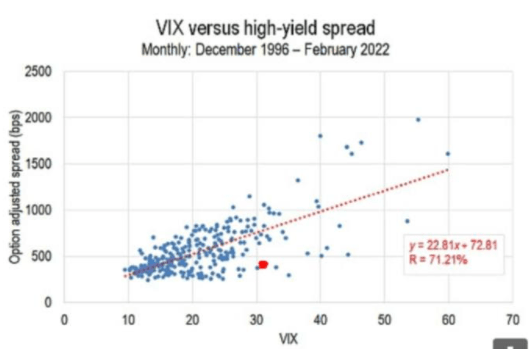
One explanation for this dynamic is that a big chunk of volatility sellers was blown out during the Volmageddon. This reduction in sellers of volatility has allowed implied volatility to rise from its previously depressed levels, raising the income of covered call funds. This means that selling volatility is now more attractive relative to taking credit risk than it was in the previous decade.
What’s It Gonna Be: ETFs Or CEFs?
A key question for investors is whether to go with ETFs or CEFs for an allocation to a given sector. Most income investors automatically reach for CEFs however in this section we discuss why investors should give ETFs a look. In this section, we look at CEFs and ETFs benchmarked to the S&P 500 to avoid any equity index bias.
First, investors often choose CEFs for the simple reason that CEFs normally deliver much higher distribution rates than ETFs. For example, while the SPDR Bloomberg High Yield Bond ETF (JNK) has a current yield of 5.8%, high-yield corporate bond CEF distribution rates range from 4% to 12.5% with the average at 9.1%. However, this is less the case in the covered call sector where ETF yields are very competitive with CEFs with many ETFs boasting significantly higher yields than CEFs. In fact, the highest-yielding covered call ETFs feature higher yields than their CEF counterparts.
Second, if we look at total return performance, CEFs lag ETFs in total NAV return terms. Since the start of the year covered call CEFs (red bars, red line = average CEF total return) are significantly lagging covered call ETFs (passive ETFs = green bars, active ETFs = blue bars).
Systematic Income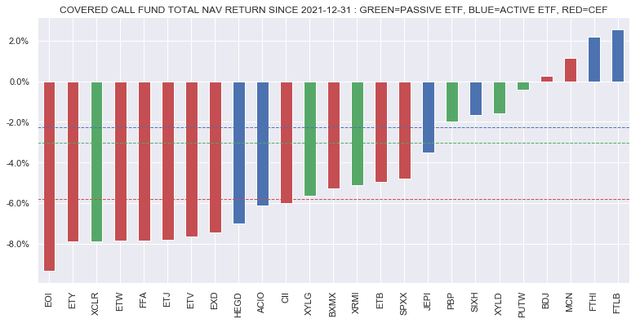
If we extend the performance window to the start of 2021 to capture an overall rising market, CEFs continue to lag ETFs as well. Unfortunately, it’s difficult to do a longer-term analysis as most covered call ETFs are relatively recent. However, the takeaway here is that investors shouldn’t assume CEFs are going to outperform automatically.
Systematic Income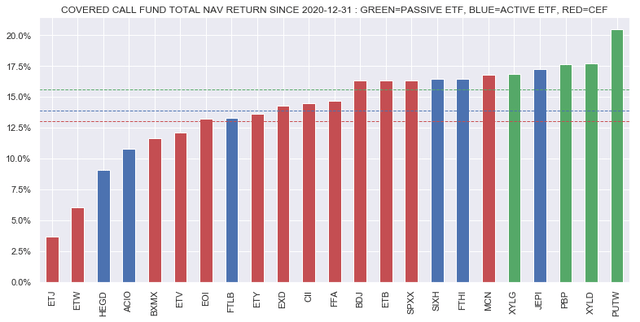
Third, covered call CEF discount valuations remain quite expensive. The chart below shows that covered call CEFs are trading at a very tight discount (y-axis) where most other sectors are trading at much wider levels. It also trades at a high 5Y discount percentile (x-axis), meaning that the sector’s discount has been more expensive only about a quarter of the time in the last 5 years – only 2 other sectors are less attractive on this metric.
Systematic Income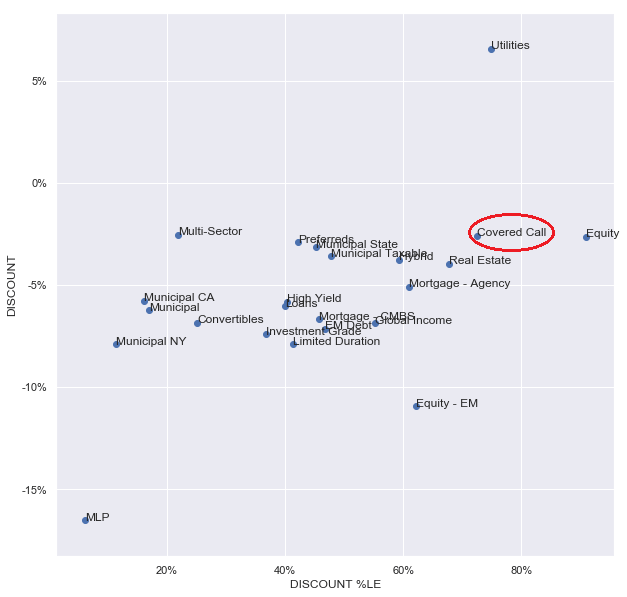
Third, covered call CEFs boast much higher management fees than ETFs.
Fourth, covered call CEFs typically don’t offer leverage which could be a way to generate additional yield putting them on par with ETFs in this regard.
Fifth, one typical advantage of CEFs is that they are, well, closed. This means they don’t need to worry about having to buy and sell underlying assets to reflect changes in investor flows. However, covered call funds typically hold highly liquid assets such as popular equity indices and their constituent members. Covered call ETFs also typically hold equity index options which are very liquid as well. This means that any potential advantage of CEFs over ETFs from their closed structure is significantly reduced due to the high liquidity of their underlying holdings.
Sixth, all covered call CEFs are actively managed whereas less than half of covered call ETFs are. All else equal, active management is, arguably, preferable to passive management. That said, if CEF active management were a key driver of outperformance we would have seen it by now and we haven’t. Plus investors who prefer to tilt to actively-managed funds can do so easily in ETFs.
Finally, a point that is often made about the covered call strategy is that it will outperform the underlying equity index during drawdowns. However, this is not actually the case for covered call CEFs, largely due to the fact that discounts tend to be procyclical as well. In short, even as covered call CEF NAVs do outperform the equity index, discounts widen during periods of market weakness so that the funds underperform significantly in price terms. The chart below shows what happened in March of 2020 to funds benchmarked to the S&P 500 – the only fund that outperformed the equity index was one with an explicit collar strategy (i.e., one that buys puts as well in addition to selling calls).
Systematic Income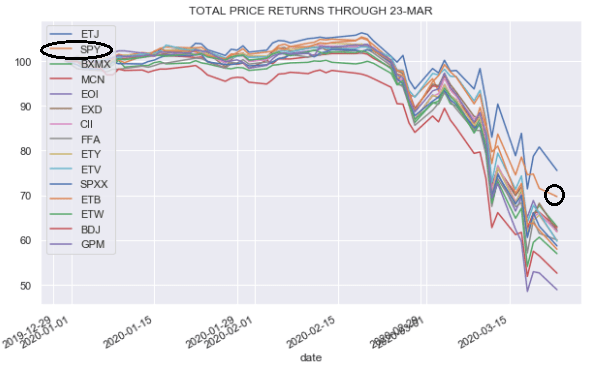
Stance And Takeaways
Within the sector we continue to like RYLD – the only ETF focused on the Russell 2000 index. A key reason for this is the fact that Russell implied volatility continues to trade above the levels of the Nasdaq and the S&P 500.
Systematic Income Tools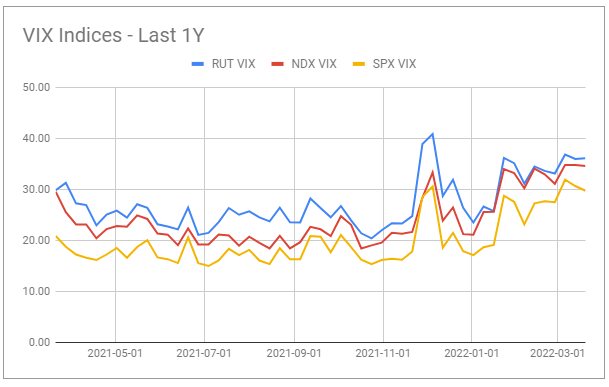
Taking a look at our Equity Income ETF Dashboard we see that the fund has put up very strong returns so far in 2022, being down only 1.4% for the year versus -9.2% for the index. This also compares very favorably to the CEF sector where the average CEF is down 7.4% in total price return terms and down 6.4% in total NAV return terms.
Systematic Income Tools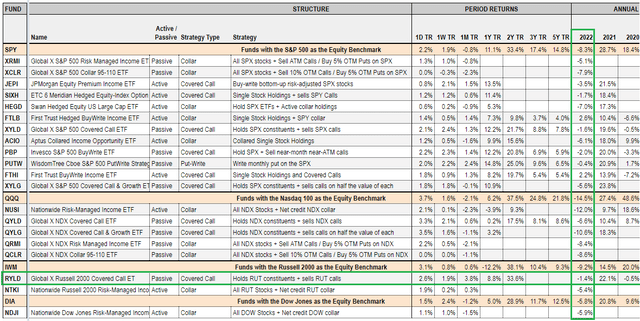
Overall, we don’t think investors with a constructive view on equities should wholesale replace their equity allocations with a covered call fund. However, it can make sense for some investors to lighten up on their credit allocation profile by tilting to a covered call ETF to monetize the very high level of implied volatility available in the market.
[ad_2]
Source links Google News

