[ad_1]

Olemedia/E+ via Getty Images
Peak speculation across investment markets took place in February 2021. Many technical analysts, like myself, assert that a broad bear market has been in place for the better part of the last 15-16 months. Of course, the S&P 500 peaked more recently on January 4 of this year. One niche that was a speculative spotlight was undoubtedly the IPO arena. Initial public offerings and special purpose acquisition vehicles (SPACs) were all the rage in early 2021. The driver was near-zero-percent interest rates and more liquidity than folks knew what to do with.
Eyeing IPO Performance
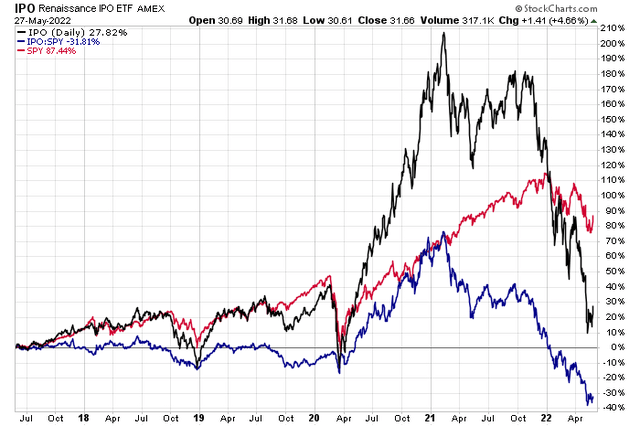
Just take a look at the performance chart below. I like to analyze the absolute and relative performances of stocks and ETFs. Over the past five years, it has been a roller coaster for the IPO ETF (which I will discuss in more fundamental detail later). The fund surged on its own and compared to the SPDR S&P 500 Trust ETF (SPY) right after the worst of the pandemic. Both the black line (the ETF) and the blue line (the relative performance) peaked in last year’s first quarter. Since then, it has been a brutal bear market for IPO stocks.
IPO, SPY, and IPO vs. SPY Last 5 Years
Stockcharts.com
But what exactly is the IPO ETF?
The Renaissance IPO ETF (NYSEARCA:IPO) is a way to place the booms and busts in IPO stocks. According to Renaissance, you will have exposure to the most significant newly-public U.S. listed companies in a portfolio before their inclusion in core U.S. equity indices with this ETF. You can dig into the ETF website for yourself to see how this fund works.
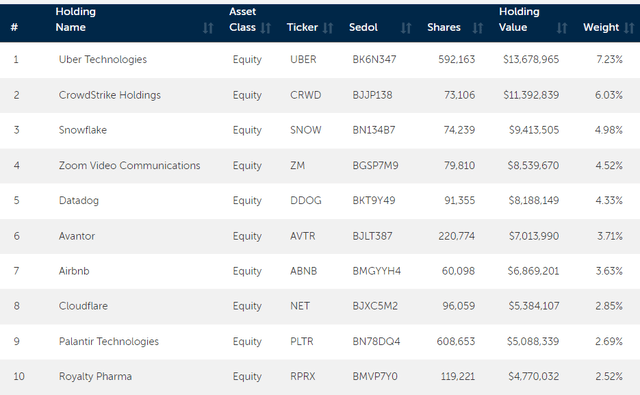
IPO’s top holdings include some familiar names that were once-sexy growth stocks. Most of them have been taken out to the woodshed. A few are even Cathie Wood’s Ark Innovation (ARKK) fund darlings. The ETF is definitely tilted to SMID-cap growth and the Information Technology sector.
IPO ETF Top 10 Holdings
Renaissance Capital
Still A “Hot” IPO Market By One Measure
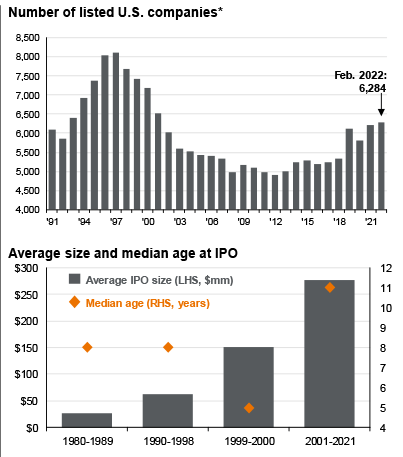
More broadly, the IPO market is actually much hotter than it was from, say, 2003 to 2018. That was a very cold stretch that saw relatively few new companies go public. The 1990s dot-com era featured a flurry of IPOs, many of which featured very small market capitalizations. Today’s average IPO size is much larger at more than $11 billion. New firms today are much more mature than those of yesteryear. That’s perhaps one reason the small-cap smart beta factor has not worked so well for the last two decades.
IPOs Are Still Trending Higher, New Firms Are Bigger Than Ever
J.P. Morgan Asset Management
Booms & Busts
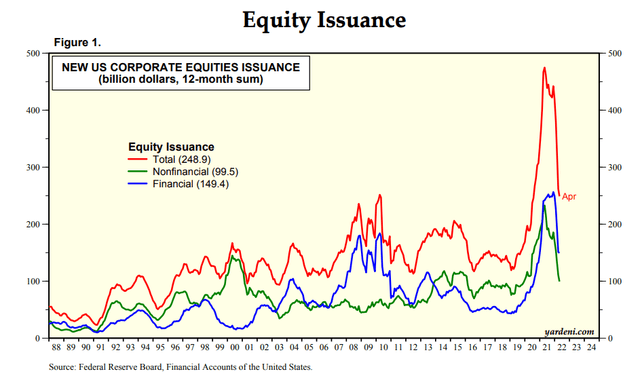
The boom-bust cycle of IPOs maybe best seen in Yardeni’s equity issuance chart below. You can’t help but notice the huge spike in 2020 and 2021. Since the peak, both nonfinancial and financial equity issuance have turned sharply lower.
Equity Issuance Down Big from the 2021 High
Yardeni.com
Factor Analysis
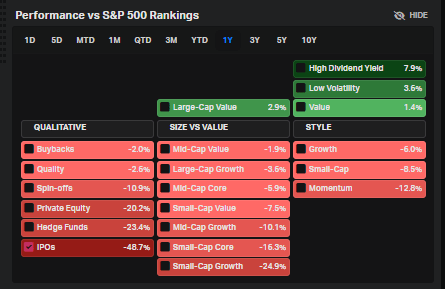
The IPO factor itself has done extremely poorly over the last year. It is by far the worst of all factors tracked on Koyfin charts. Investors have sought the safety of large-cap value and high dividend stocks. Speculation and retail fervor is a thing of the past.
The IPO Factor’s Fall From Grace
Koyfin Charts
IPO Corporate Events
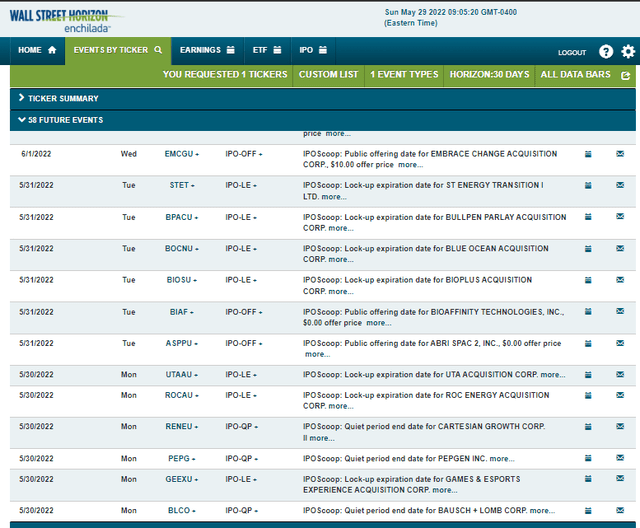
On tap this week are several key lock-up period expiration dates and a few IPOs to monitor. Corporate event data provider Wall Street Horizon tracks all the key IPO-related dates. I notice that ASPPU and BIAF go public Tuesday, while EMCGU hits the tape on Thursday. Keep close tabs on lock-up period expirations though – stocks sometimes see a selling cascade right when the period ends (just take a look at Rivian (RIVN) shares a few weeks ago).
IPO Calendar This Week
Wall Street Horizon
IPO ETF: Bullish or Bearish?
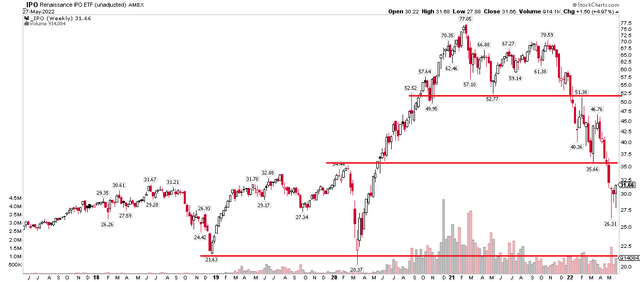
Turning back to the IPO ETF, what do the charts say? It looks grim. IPO has fallen under its pre-pandemic high after breaking two key support levels. $52 was the Q2 2021 low – that was lost earlier this year. Then came the breakdown below the $36 level – the pre-pandemic peak. Shares eventually bottomed at $26.31 in May. I see ultimate support in the $20-22 area. On the upside, bounces should be sold into those old support prices. The polarity principle says that what was once support becomes new resistance.
IPO ETF: Support in the Low $20s, Overhead Resistance In Play
Stockcharts.com
The Bottom Line
IPO boom and bust cycles can be perilous. Investors today can play it via the IPO ETF. The chart is bearish, but there are key trading levels to consider. I think shares can rally to $36, but then overhead supply likely comes into play. I would be a buyer long-term once IPO tags the low $20s.
[ad_2]
Source links Google News

