[ad_1]
The VanEck Vectors® Real Asset Allocation ETF (NYSEARCA:RAAX) uses a data-driven, rules-based process that leverages over 50 indicators (technical, macroeconomic and fundamental, commodity price, and sentiment) to allocate across 12 individual real asset segments in five broad real asset sectors. These objective indicators identify the segments with positive expected returns. Then, using correlation and volatility, an optimization process determines the weight to these segments with the goal of creating a portfolio with maximum diversification while reducing risk. The expanded PDF version of this commentary can be downloaded here.
Summary
The VanEck Real Asset Allocation ETF returns to a full allocation in real asset sectors.
- Markets continued to recover in February, driven by the newly adopted policy of patience from the U.S. Federal Reserve (Fed). Global stocks were up, bonds were down, and real assets were mixed. Now, all eyes are on economic activity and a potential trade deal with China.
- Risks have diminished across real asset investments. RAAX turned bullish on almost all real assets based on positive price trends, normalized volatility, strong commodity prices, and supportive macroeconomic and fundamental factors. This marks a big shift from last month’s strongly defensive posture.
- Gold pulled back slightly in February, but the bull case for the precious metal remains intact; slowing economic growth and trade tensions with China create a heightened risk regime, and a dovish Fed creates headwinds for the U.S. dollar.
| 1 Mo† | YTD† | 1 Year | Life (04/09/18) |
|
| RAAX (NAV) | 0.69 | 0.69 | – | -0.32 |
| RAAX (Share Price) | 0.04 | 0.64 | – | -0.24 |
| Blended Real Asset Index* | 1.13 | 9.63 | – | 1.05 |
| 1 Mo† | YTD† | 1 Year | Life (04/09/18) |
|
| RAAX (NAV) | 1.13 | – | – | -1.00 |
| RAAX (Share Price) | 1.21 | – | – | -0.88 |
| Blended Real Asset Index* | -5.84 | – | – | -7.84 |
The table presents past performance which is no guarantee of future results and which may be lower or higher than current performance. Returns reflect temporary contractual fee waivers and/or expense reimbursements. Had the ETF incurred all expenses and fees, investment returns would have been reduced. Investment returns and ETF share values will fluctuate so that investors’ shares, when redeemed, may be worth more or less than their original cost. ETF returns assume that distributions have been reinvested in the Fund at “Net Asset Value” (NAV). NAV is determined at the close of each business day, and represents the dollar value of one share of the fund; it is calculated by taking the total assets of the fund, subtracting total liabilities, and dividing by the total number of shares outstanding. The NAV is not necessarily the same as the ETF’s intraday trading value. VanEck Vectors ETF investors should not expect to buy or sell shares at NAV.
†Returns less than a year are not annualized.
Expenses: Gross 0.81%; Net 0.74%. Expenses are capped contractually at 0.55% through February 1, 2020. Expenses are based on estimated amounts for the current fiscal year. Cap excludes certain expenses, such as interest, acquired fund fees and expenses, and trading expenses.
Performance and Positioning
Performance for the VanEck Vectors Real Asset Allocation ETF was flat in February. RAAX was 20% invested in gold bullion and 80% invested in T-bills. While gold bullion was down slightly last month, this was offset by the incremental yield earned from holding T-bills.
In February, there was a significant dispersion in the returns of real asset investments. Some assets were up, such as global infrastructure and MLPs. Other assets were down, such as gold and coal equities. And other assets posted marginal returns, like unconventional oil & gas and agribusiness equities.
RAAX transitioned from its strongly defensive posture to a fully allocated, diversified portfolio of real asset investments. It now holds a 33% allocation to gold and gold equities, a 30% allocation to natural resource equities, a 20% allocation to global infrastructure, a 12% allocation to REITs, and a 5% allocation to MLPs.
Digging Deeper into Real Assets
RAAX is now fully engaged in the market. It no longer holds T-bills, rather a well-diversified portfolio of real asset investments. Real asset prices are up significantly from the lows of late December. So, why buy them now? RAAX waits for risks to subside before re-engaging.
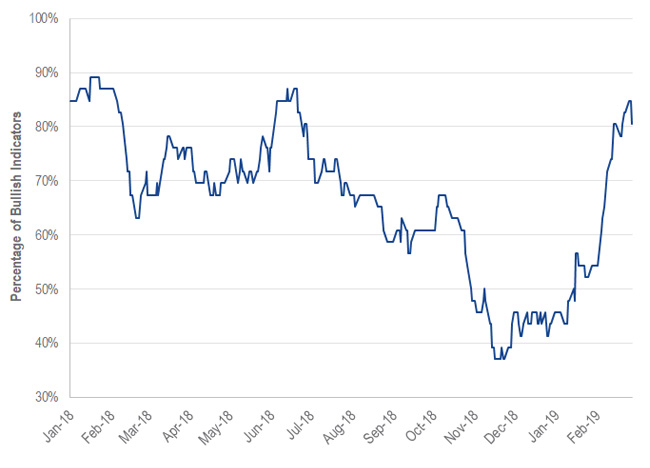
Most real asset price trends have turned bullish, volatility has subsided, and many of the macroeconomic and fundamental factors are supportive of real assets. Historically, these conditions have coincided with healthy growth in real asset prices. Below is an aggregation of all the indicators that drive RAAX. Currently, 80% of the indicators are bullish, up from a recent low of 37%.
Taking the Defense Off the Field: Aggregate of RAAX Indicators Strongly Bullish
(January 1, 2018, to February 28, 2019)
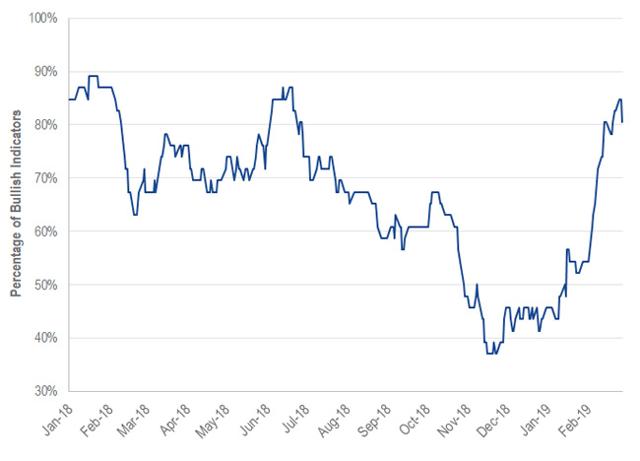
Source: VanEck. Data as of February 28, 2019. Past performance is no guarantee of future results. Charts are for illustrative purposes only.
As of the end of February, the Fund’s benchmark, a hypothetical basket of diversified real assets (without fees or transaction costs), is at the same level it was in October of 2018, and lower than it was at the beginning of 2018. Investors in RAAX, since its launch in April of 2018, generally finished in the same spot as those who bought and held such a basket of diversified real assets.
Different Routes Taken but Finishing Close: Returns of RAAX vs. Blended Benchmark
(April 10, 2018, to February 28, 2019)
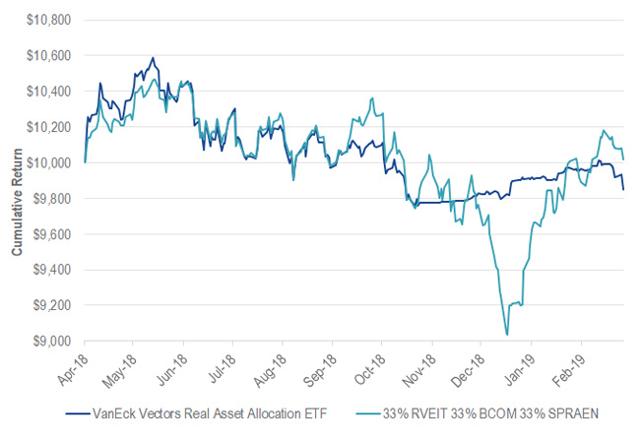
Source: FactSet. Data as of February 28, 2019. Past performance is no guarantee of future results. Charts are for illustrative purposes only. Investors cannot invest directly in an index.
But how RAAX investors got there was much more pleasant. RAAX avoided the bulk of the drawdown and, most importantly, transitioned to an ultra-low volatility and highly uncorrelated asset when they needed it most. This chart shows the significant decrease in volatility in RAAX when volatility was quickly accelerating in other assets.
When Volatility Picked Up, RAAX Got Defensive: Standard Deviation of RAAX, S&P 500, BCOM
(Rolling 20-Day Periods from April 10, 2018, to February 28, 2019)
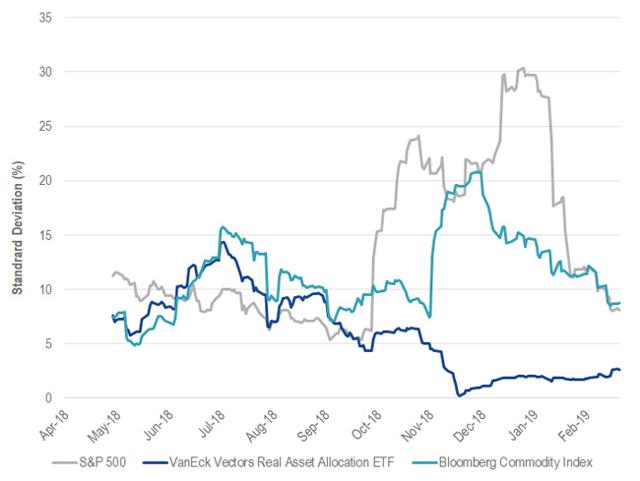
Source: FactSet. Data as of February 28, 2019. Past performance is no guarantee of future results. Charts are for illustrative purposes only. Investors cannot invest directly in an index.
And, because RAAX was making money when other risky asset classes were losing money, it became negatively correlated and added much-needed portfolio diversification.
Uncorrelated Return Adds Diversification: Correlation of RAAX to S&P 500 and BCOM
(Rolling 20-Day Periods from April 10, 2018, to February 28, 2019)
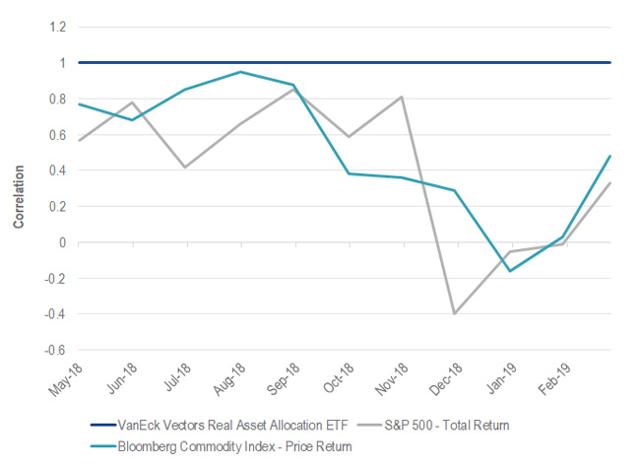
Source: FactSet. Data as of February 28, 2019. Past performance is no guarantee of future results. Charts are for illustrative purposes only. Investors cannot invest directly in an index.
Investing is not supposed to be exciting. RAAX did its part by helping to minimize the stress that came from big swings in investor account balances. During more significant market declines, it is our expectation that RAAX will not only potentially protect on the downside, but also outperform by minimizing losses and reducing the gains needed to recover.
March Positioning
RAAX transitioned from its strongly defensive posture to a fully allocated, diversified portfolio of real asset investments. It now holds a 33% allocation to gold and gold equities, a 30% allocation to natural resource equities, a 20% allocation to global infrastructure, a 12% allocation to REITs, and a 5% allocation to MLPs.
Real Asset Sector and Asset Class Weights
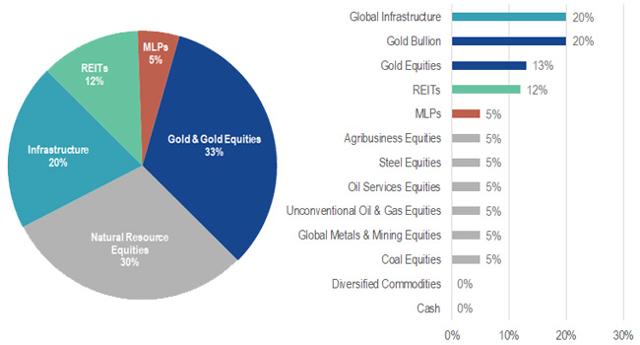
Source: VanEck. As of March 2019.
Monthly Asset Class Changes
| Real Asset Segment | Mar-19 | Feb-19 | Change from Previous Month | |
|---|---|---|---|---|
| Global Infrastructure | 20% | 0% | 20% | Increase |
| Gold Equities | 13% | 0% | 13% | Increase |
| REITs | 12% | 0% | 12% | Increase |
| Coal Equities | 5% | 0% | 5% | Increase |
| Agribusiness Equities | 5% | 0% | 5% | Increase |
| Oil Service Equities | 5% | 0% | 5% | Increase |
| Unconventional Oil & Gas Equities | 5% | 0% | 5% | Increase |
| Master Limited Partnerships | 5% | 0% | 5% | Increase |
| Global Metals & Mining Equities | 5% | 0% | 5% | Increase |
| Steel Equities | 5% | 0% | 5% | Increase |
| Gold Bullion | 20% | 20% | 0% | No Change |
| Diversified Commodities | 0% | 0% | 0% | No Change |
| Cash | 0% | 80% | -80% | Decrease |
Source: VanEck. Data as of March 2019. Past performance is not indicative of future results.
Important Disclosure
Please note that the information herein represents the opinion of the author, but not necessarily those of VanEck, and these opinions may change at any time and from time to time. Non-VanEck proprietary information contained herein has been obtained from sources believed to be reliable, but not guaranteed. Not intended to be a forecast of future events, a guarantee of future results or investment advice. Historical performance is not indicative of future results. Current data may differ from data quoted. Any graphs shown herein are for illustrative purposes only. No part of this material may be reproduced in any form, or referred to in any other publication, without express written permission of VanEck.
This content is published in the United States for residents of specified countries. Investors are subject to securities and tax regulations within their applicable jurisdictions that are not addressed on this content. Nothing in this content should be considered a solicitation to buy or an offer to sell shares of any investment in any jurisdiction where the offer or solicitation would be unlawful under the securities laws of such jurisdiction, nor is it intended as investment, tax, financial, or legal advice. Investors should seek such professional advice for their particular situation and jurisdiction.
The Blended Real Assets Index consists of an equally weighted blend of the returns of Bloomberg Commodity Index, S&P Real Assets Equity Index, and VanEck® Natural Resources Index. Equal weightings are reset monthly. The S&P Real Assets Equity Index measures the performance of equity real return strategies that invest in listed global property, infrastructure, natural resources, and timber and forestry companies. The VanEck Natural Resources Index is a rules-based index intended to give investors a means of tracking the overall performance of a global universe of listed companies engaged in the production and distribution of commodities and commodity-related products and services. Sector weights are set annually based on estimates of global natural resources consumption, and stock weights within sectors are based on market capitalization, float-adjusted and modified to conform to various asset diversification requirements. The S&P 500® Index (S&P 500) consists of 500 widely held common stocks, covering four broad sectors (industrials, utilities, financial and transportation).
The S&P Real Assets Equity Index is a product of S&P Dow Jones Indices LLC and/or its affiliates and has been licensed for use by Van Eck Associates Corporation. Copyright © 2019 S&P Dow Jones Indices LLC, a division of S&P Global, Inc., and/or its affiliates. All rights reserved. Redistribution or reproduction in whole or in part is prohibited without written permission of S&P Dow Jones Indices LLC. For more information on any of S&P Dow Jones Indices LLC’s indices please visit www.spdji.com. S&P® is a registered trademark of S&P Global and Dow Jones® is a registered trademark of Dow Jones Trademark Holdings LLC. Neither S&P Dow Jones Indices LLC, Dow Jones Trademark Holdings LLC, their affiliates nor their third party licensors make any representation or warranty, express or implied, as to the ability of any index to accurately represent the asset class or market sector that it purports to represent and neither S&P Dow Jones Indices LLC, Dow Jones Trademark Holdings LLC, their affiliates nor their third party licensors shall have any liability for any errors, omissions, or interruptions of any index or the data included therein.
The Solactive MLP & Energy Infrastructure Index tracks the performance of MLPs and energy infrastructure corporations. The MVIS U.S. Listed Oil Services 25 Index is intended to track the overall performance of U.S.-listed companies involved in oil services to the upstream oil sector, which include oil equipment, oil services, or oil drilling. The Dow Jones Equity All REIT Index, designed to measure all publicly traded real estate investment trusts in the Dow Jones U.S. stock universe classified as equity REITs according to the S&P Dow Jones Indices REIT Industry Classification Hierarchy. The NYSE Arca Gold Miners Index is a modified market capitalization-weighted index composed of publicly traded companies involved primarily in the mining for gold. The Index is calculated and maintained by the New York Stock Exchange. The S&P® North American Natural Resources Sector Index: a modified capitalization-weighted index which includes companies involved in the following categories: extractive industries, energy companies, owners and operators of timber tracts, forestry services, producers of pulp and paper, and owners of plantations. The S&P® GSCI Total Return Index: is a world production-weighted commodity index comprised of liquid, exchange-traded futures contracts and is often used as a benchmark for world commodity prices.
Any indices listed are unmanaged indices and include the reinvestment of all dividends, but do not reflect the payment of transaction costs, advisory fees or expenses that are associated with an investment in the Fund. Certain indices may take into account withholding taxes. An index’s performance is not illustrative of the Fund’s performance. Indices are not securities in which investments can be made.
An investment in the Fund may be subject to risks which include, among others, fund of funds risk which may subject the Fund to investing in commodities, gold, natural resources companies, MLPs, real estate sector, infrastructure, equities securities, small- and medium-capitalization companies, foreign securities, emerging market issuers, foreign currency, credit, high yield securities, interest rate, call and concentration risks, all of which may adversely affect the Fund. The Fund may also be subject to affiliated fund, U.S. Treasury Bills, subsidiary investment, commodity regulatory, tax, liquidity, gap, cash transactions, high portfolio turnover, model and data, management, operational, authorized participant concentration, absence of prior active market, trading issues, market, fund shares trading, premium/discount and liquidity of fund shares, and non-diversified risks. The Fund’s assets may be concentrated in a particular sector and may be subject to more risk than investments in a diverse group of sectors.
Diversification does not assure a profit or protect against a loss.
Fund shares are not individually redeemable and will be issued and redeemed at their net asset value (NAV) only through certain authorized broker-dealers in large, specified blocks of shares called “creation units” and otherwise can be bought and sold only through exchange trading. Shares may trade at a premium or discount to their NAV in the secondary market. You will incur brokerage expenses when trading Fund shares in the secondary market. Past performance is no guarantee of future results.
Investing involves substantial risk and high volatility, including possible loss of principal. Bonds and bond funds will decrease in value as interest rates rise. An investor should consider the investment objective, risks, charges and expenses of the Fund carefully before investing. To obtain a prospectus and summary prospectus, which contain this and other information, call 800.826.2333 or visit vaneck.com. Please read the prospectus and summary prospectus carefully before investing.
Editor’s Note: The summary bullets for this article were chosen by Seeking Alpha editors.
[ad_2]
Source link Google News

