[ad_1]
This article was originally written a few weeks ago, so some market-sensitive figures may be out of date.
ETRACS Monthly Pay 2xLeveraged Preferred Stock (NYSEARCA:PFFL) is a recent addition to the UBS suite of leveraged ETNs. These products are passive vehicles that take an underlying index and provide double monthly compounded exposure after fees. With rich valuations on fixed-income instruments, marked by low long-term yields and tight credit spreads, leveraged instruments can look attractive.
Our view, however, is that in the case of PFFL, investors are only getting a small pick-up in yield relative to the underlying index as most of the additional yield generated by the second turn of leverage is, in fact, eaten up by costs. We think investors would be best served by holding preferred CEFs, the active preferred ETF FPE or even leveraging the PFFL underlying index themselves.
Hiding The Ball On Yield?
PFFL is a passive vehicle that tracks an index of two equally-weighted preferred ETFs: PFF and PGX. The PFFL fund page states that, as of September 2018, the 2x Index Yield is 10.96%. From this statement, it is tempting to conclude that the fund’s true yield is, therefore, around 10.96%. And, in fact, 2x the average of various yields of the underlying funds does add up to around 11%. Does this mean that this is the true yield of PFFL? Yes and No.
We often hear the refrain that yield is all that matters. We have some sympathy with this view, however, a fund like PFFL provides a case in point which challenges the universal applicability of this view.
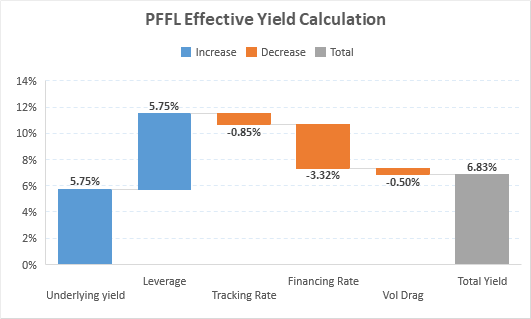
It is true that PFFL has been paying out a yield of around 10% since inception, however, the additional costs of generating that yield are not actually included in the distributions themselves. Instead, they are accrued against the NAV. This is not unusual and can usually be ignored, particularly for products with low fees. However, the total costs of PFFL are on the order of 10x that of a standard ETF, so, in this case, it cannot be easily ignored. So in order to gauge the fund’s actual cash-generation ability, we need to add the fees back in. This calculation is summarized in the chart below.
Source: ADS Analytics LLC, UBS
- Underlying Yield – this is the average yield of the PFFL index. Whether you use the TTM or current yield, the figure is about the same
- Leverage – this is the additional yield you get for the second turn of leverage of the underlying index
- Tracking Rate – the effective expense of PFFL
- Financing Rate – this is the current financing charge by UBS for providing access to the second turn of leverage. This rate will vary based on 3-Month Libor
- Vol Drag – current and expected volatility drag of PFFL which we describe in more detail below.
So, the effective yield of PFFL is currently 6.83% or just over 1% above the underlying index. So, one way to look at the fund is that, after costs, PFFL provides a pick-up of 1% in yield against an increase in 100% more risk.
In fact, the 100% risk figure understates the additional risk when you include the fact that PFFL investors are not compensated for additional credit risk of UBS (which the ETF holders avoid). This credit risk is worth about 0.50-1.00% per annum depending on the term. The second additional risk to ETN holders over the underlying ETF holders is the possibility of early redemption which is what happened to MLPL and MLPV. In our view, these two risks are minimal – UBS is a pretty sound bank with more focus on wealth management than trading and preferred stocks have a much lower volatility than MLPs and so less likely to trigger early redemption of the ETN. That said, these two additional risks are surely not worth zero.
Does it make sense to more than double your risk for an extra 1% of yield? It depends. For investors with a bullish tactical view on preferreds, it very well may make sense. For pure yield investors, we are not so sure.
One additional consequence of the small yield pick-up of PFFL over its underlying index is that UBS is taking more fees on PFFL than the additional yield it provides to investors. This looks clearly wrong to us.
How has PFFL performed relative to its underlying index?
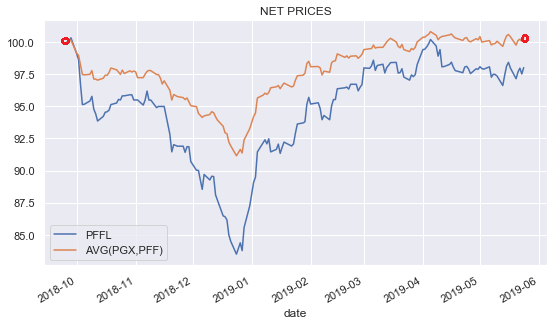
It is quite telling to make the comparison at this time because fortuitously the underlying index has made a round-trip from the date of PFFL inception to today. This minimizes the actual price impact of the index on total returns leaving yield and fees to make up the total return and making the return comparison quite clean.
Source: ADS Analytics LLC
So, what do we find? Based on our yield calculation and no additional impact from the price change in the index, our prediction from the underlying yield, fees, and volatility drag would be that PFFL should have outperformed the index by less than 1%. Indeed this is what we find. 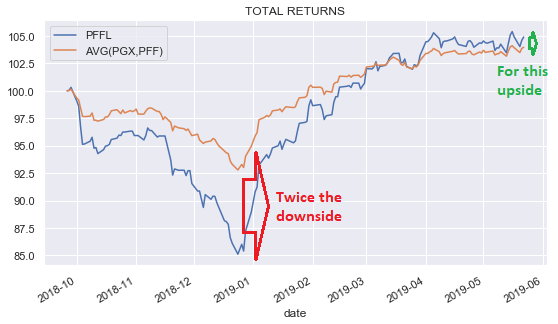
Source: ADS Analytics LLC, Tiingo
What Does This Mean For Investors?
In our view, investors have better alternatives at their disposal than PFFL. In our order of preference:
- Investors can hold preferred CEFs. CEFs also benefit from active management and most CEFs have higher yields than the PFFL after-cost yield and with lower volatility to boot.
- Total return investors who like the ETF wrapper or who would like to minimize volatility can hold an active ETF like FPE which we think stands a good chance of outperforming the passive ETFs despite a higher expense base.
- For investors who actually want to hold the two underlying ETFs in the PFFL index and want the additional yield pickup, it is cheaper to leverage the ETFs yourself rather than going through UBS. The additional task of rebalancing the ETFs can either be avoided or implemented more cheaply.
In the sections below, we dig a little bit more into PFFL and flesh out some of our views discussed above.
PFFL Fund Structure
The PFFL fee structure is the following:
- Annual Tracking Rate: 0.85%
- Financing Rate: 3-Month Libor + 0.80% (currently, 3.32%)
There are many brokers who charge exorbitant margin fees that go into the high single digits; however, there are also discount brokers that are very competitive. For example, Interactive Brokers charges Fed Funds + 1.5% which at the time of writing worked out to 3.88% (this can go down to as low as Fed Funds + 0.3% or 2.68% for large amounts).
Once you factor in the Tracking Rate, the total cost of PFFL currently works out to 4.17% or 0.29% more expensive than leveraging via IB.
Now, granted, trading on margin takes some extra effort plus fund providers like UBS do all the behind-the-scenes work of managing to an index and rebalancing the positions, so often it is worth going with a fund who does all this for you.
The trouble with PFFL, however, is that the underlying index – Solactive Preferred Stock ETF Index – is comically simple. It is literally the simplest index anyone could think of – two equally weighted positions. The index 14-page guidebook talks soberly of such risks as nationalization or insolvency of index components, which, if you are worried about the US government nationalizing PFF or PGX is fair enough.
As far as rebalancing, yes, PFFL will manage all this for you. Two points come to mind here, however. First, rebalancing does take extra work, but if you don’t want to do it, then just don’t. There is a lot of literature about portfolio rebalancing with some commentators describing it as a source of alpha. However, in general, this is just not true – rebalancing is not a magic source of alpha. If you continuously rebalance into an asset that is consistently underperforming, you are not making more money – you are losing more money.
The only real benefit from rebalancing is to maintain your desired risk profile; however, this only applies to portfolios with different assets like stocks and bonds. If all you hold is two very very similar ETFs, your risk will pretty much remain the same regardless of whether you rebalance or not.
As far as the PFFL underlying index, it is unfortunate and puzzling why UBS has chosen to go with ETFs instead of actual preferred securities. By going with the ETFs, PFFL has to eat an additional layer of fees which add up to just under 1% per annum.
A final point on the structure is related to tax and is not really a complaint since it’s not something UBS can control. But since FPPL is structured as an ETN, its distributions are treated as ordinary income rather than qualified dividends. This may not be an issue for tax-free accounts or for investors falling into low tax brackets; however, for those banking on the qualified dividend rate, it is an issue.
Volatility Drag
There are many articles on the internet warning investors about the dangers of leveraged exchange-traded products. This is not one of them. We are not going to tell you that your firstborn will not make it into her first choice school if you trade a leveraged ETF. We think leveraged ETFs can be a reasonable choice over the short term or the long term.
For all the hoopla about leveraged ETFs, you might think that a fund like SSO which is 2x leveraged on the S&P 500 that started inauspiciously in 2006 would have gotten blown out during the crisis. However, since inception, the fund’s return is 10.27% vs. 8.28% for SPY. It’s a far cry from double, but it’s not underperforming SPY either.
Clearly, over the long-term, no one should expect an exact 2x or 3x return on the underlying asset. Volatility drag (and fees) is the bit that eats into the leveraged fund returns that prevent you from getting that exact 2x or 3x return. However, if you are long a growth asset (like stocks) and volatility drag is not so high that it kills you (it usually never is as it wasn’t during the crisis for SSO), then you have a good shot at beating the asset that is being leveraged.
In fact, growth assets that do not show excessive volatility – yes, those are hard to find but go with it for the moment – can actually turn volatility drag into a volatility boost. To take an obviously made up example, let’s see what happens to an asset that has +1% monthly returns. We can see that its total return is more than double the underlying index. The reason this doesn’t happen in practice because growth asset returns tend to be a lot more volatile and more mean-reverting – characteristics which contribute to volatility drag.
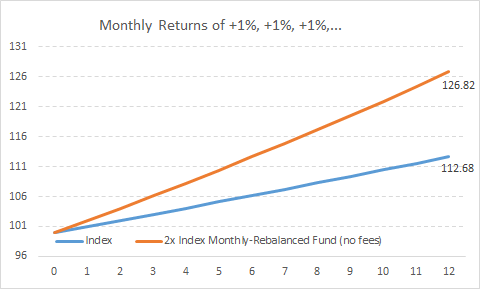
Source: ADS Analytics LLC
The trouble with PFFL is that its underlying index is not a growth index and it is not particularly low volatility. Preferred stocks have a well-defined principal repayment which makes it difficult for them to appreciate in the same way as common stocks. So, the fact that preferred stocks are more mean-reverting can contribute to volatility drag.
To get some intuition around this, let’s have a look at PFFL monthly returns. The median monthly absolute return since inception has been about 2.6%. Let’s see what sort of volatility drag is created by a mean-reverting 2.6% monthly return asset. The answer is about -0.80% per annum (-1.61% return of the 2x Fund vs. a 0.4% return on the Index). This figure does not depend on the actual placement of 2.6% and -2.6% returns so long as the number of positive returns is the same as the number of negative returns. A volatility drag of -0.80% for PFFL is not massive, but it’s also not trivial in the context of a total return of about 5% since inception.
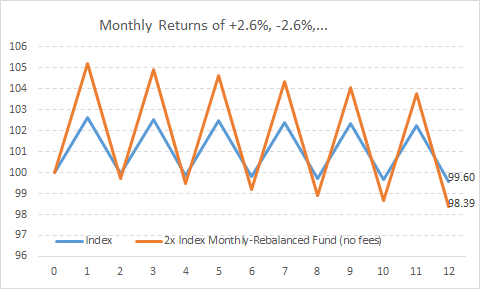
Source: ADS Analytics LLC
PFFL Fund Index
The underlying ETFs PFF and PGZ are passive ETFs that track the following indices:
- ICE Exchange-Listed Preferred & Hybrid Securities Index
- ICE BofAML Core Plus Fixed Rate Preferred Securities Index
There is a healthy debate about active vs. passive investing in financial markets. There is some evidence to suggest that within fixed-income the active approach wins out.
To gauge the performance of active vs. passive vehicles within the preferred sectors, we can compare the performance of the two passive ETFs underlying PFFL against CEFs with appropriate adjustments. As the chart below suggests, preferred CEFs have outperformed the ETFs on an absolute (adjusted for leverage) and risk-adjusted basis.
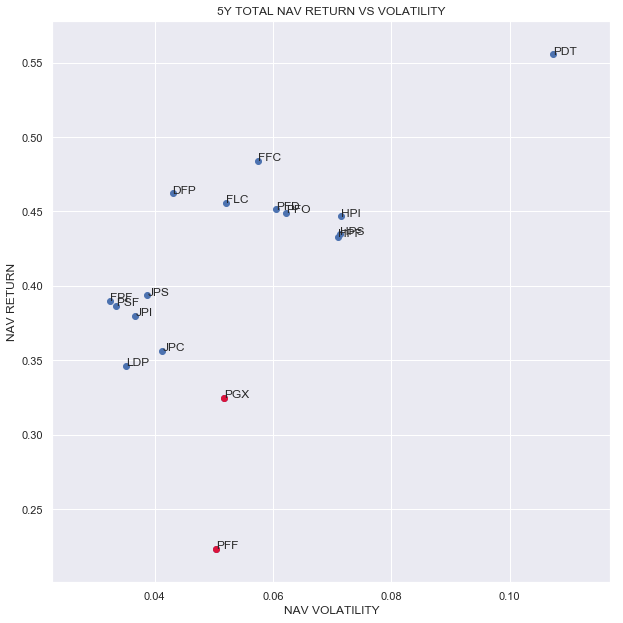
Source: ADS Analytics LLC, Tiingo
On the ETF side, the evidence is more mixed. If we compare the performance of the two passive ETFs against the active ETF FPE, the passive combo narrowly edges out the active ETF while the risk-adjusted performance of the active ETF is better.

Source: ADS Analytics LLC, Tiingo
Apart from the general question of passive vs. active exposure, the PFFL Index exposure leans in a few clear directions. By virtue of this index exposure, PFFL appears to be overweight:
- US-based company securities
- Fixed-rate securities
- 25-Par securities
In our view, these sector leans miss the potential to take advantage of attractive and broader opportunities within the preferred market.
The US-company overweight avoids the attractive European contingent convertible market which PIMCO have been bullish on for some time.
The preference for fixed-rate securities raises the interest-rate sensitivity of the ETFs and may miss out on attractive floating-rate securities particularly at a time when short-term interest rates have risen appreciably from their lows.
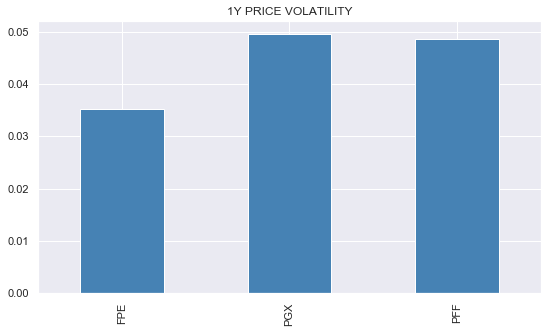
For example, FPE, which holds more fixed-to-float securities, has a significantly lower empirical duration than the two passive ETFs.
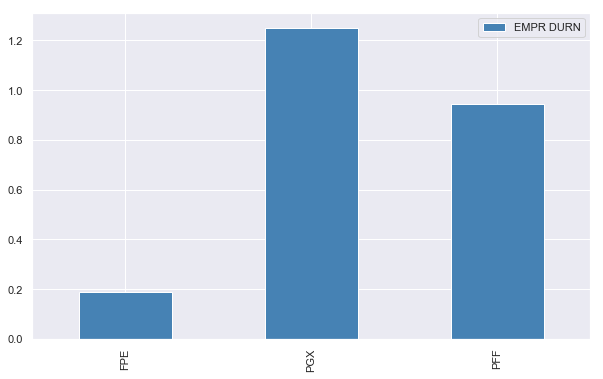
Source: ADS Analytics LLC, Tiingo
This translates into lower price volatility as well.
Source: ADS Analytics LLC, Tiingo
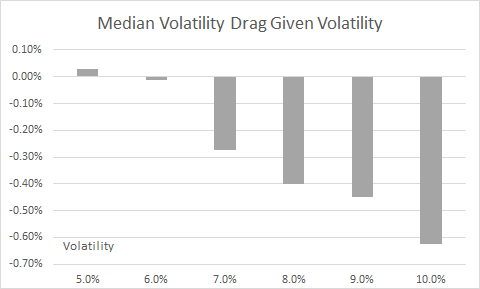
Why do we care about volatility? We care about volatility in general because it keeps behavioral monsters at bay and helps keep drawdowns contained. In the case of leveraged funds, we also care about volatility because lower volatility minimizes volatility drag as we can see in the chart below.
Source: ADS Analytics LLC
Finally, the overweight of retail-focused $25-par preferreds, particularly in a passive vehicle means the funds can hold securities with negative yield-to-call. The $25-par securities also have a limited number of rate reset features which further limits the ability of the fund to take advantage of relative value opportunities.
We think these features of the passive preferreds ETFs make them unappealing as an investment in unleveraged or leveraged format.
Conclusion
In a land of low yield, PFFL may look attractive to income investors. In our view, however, this is not the case. PFFL provides little additional yield pick-up for more than doubling of the risk taken by the investor. In fact, the fund issuer has higher fees than the additional yield provided by the ETN. Furthermore, the PFFL underlying index has unattractive sector leans which we think should underperform over the medium term. We think investors should instead choose actively managed vehicles like preferred CEFs which have shown consistently better absolute and risk-adjusted returns.
Check out Systematic Income and get immediate access to the charts and data used in our articles for hundreds of funds.
Explore the best funds and sectors as well as our yield-target portfolios and systematic investment strategies.
Check us out on a no-risk basis – sign up for a free trial!
Disclosure: I/we have no positions in any stocks mentioned, and no plans to initiate any positions within the next 72 hours. I wrote this article myself, and it expresses my own opinions. I am not receiving compensation for it (other than from Seeking Alpha). I have no business relationship with any company whose stock is mentioned in this article.
[ad_2]
Source link Google News

