")
[ad_1]
Nattakorn Maneerat/iStock via Getty Images
Investment Thesis
At first glance, the iShares Russell 2000 ETF, which trades under the symbol (NYSEARCA:IWM), might seem like an attractive investment after the recent price decline, as the forward P/E ratio of the index companies is only 23.4x – about the level of the years before the pandemic, according to Yardeni Research’s study:
Forward P/E: Russell 2000, Yardeni Research, Inc., January 31, 2022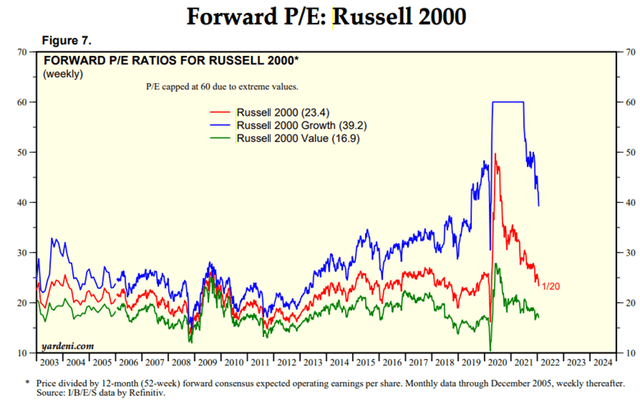
However, there are some reasons why I am inclined to believe that buying IWM on the current drawdown does not make sense, because the Russell 2000 Index still seems overvalued. And even if I am wrong about the overvaluation, there are much more interesting instruments in the ETF market with lower fees and better component selection methodology.
Why?
First off, you should understand what exactly is included in this index – it is a compilation of small-cap stocks that includes both value companies and fast-growing companies without specific filtering and focuses not on the business cycle, but solely on market capitalization, which can be low not only when the company is young and growing fast, but also when it is stagnant (e.g. representatives of the energy/utilities sector).
Moreover, when compared to its peer – S&P 600 small-cap index, ticker (SP600) – IWM looks heavily overvalued (by about 71%), even despite a rather low P/E ratio:
FORWARD P/E RATIOS FOR US SMALLCAP* (weekly)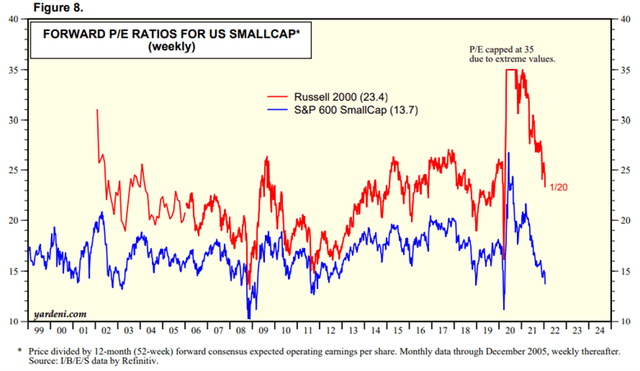
Unlike the IWM, the SP600 takes a fairly balanced approach to selecting stocks for its index, which reduces investment risks, even though the method of stock selection involves banal filtering by operational metrics:
Compiled by the author based on iShares and SPGlobal websites ()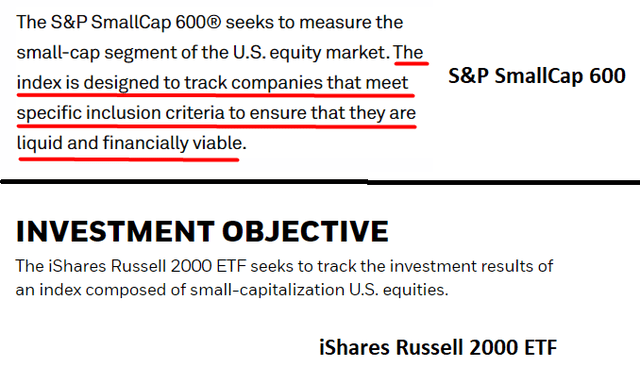
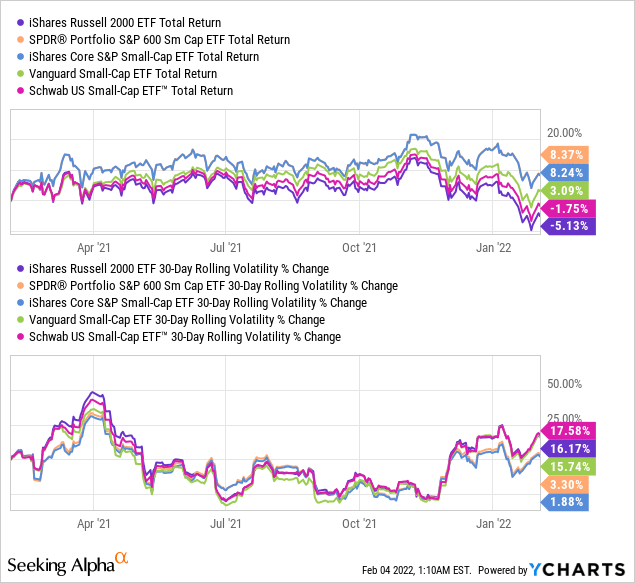
Moreover, IWM’s profitability is “eaten up” by a higher commission – if SP600 takes only 0.05% for management with a dividend yield of 1.52% per year (quarterly payments), IWM takes as much as 0.19% yielding 1.05% per annum. That sounds like a small difference until we compare their actual historical returns:
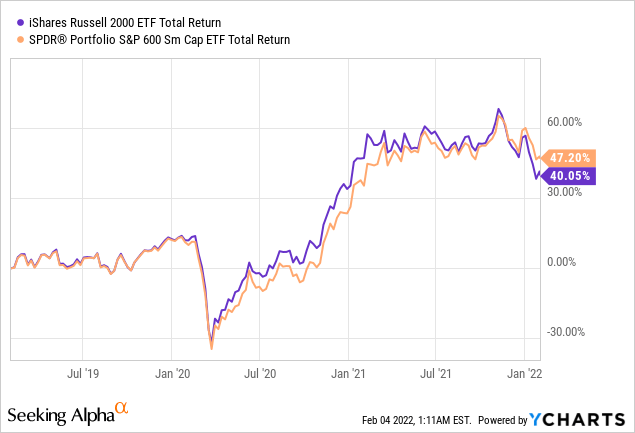
Over the past 3 years, a potential investor would have “underearned” 7.15% with approximately the same level of risk (the correlation of returns is strongly positive, clearly above ~0.9). Therefore, the question is logical – why overpay for management if it does not bring a significant bonus in the form of additional profitability or risk reduction?
However, this is not the main reason why I recommend avoiding IWM – the fact is that with such a high P/E ratio (as it turned out) compared to the S&P SmallCap 600 Index (PSSIX), more than 40% of all companies included in the Russell 2000 Index are unprofitable (data presented at Barron’s Expert Conference in late January 2022). At the same time, in the main benchmark of the main U.S. stock market (S&P 500), only 1.4% are unprofitable, making the Russell 2000 Index highly overvalued at current P/E levels (according to Scott Black, founder/president of Delphi Management, the overvaluation is about 28 times):
Percent of unprofitable companies inside Russell 2000 Index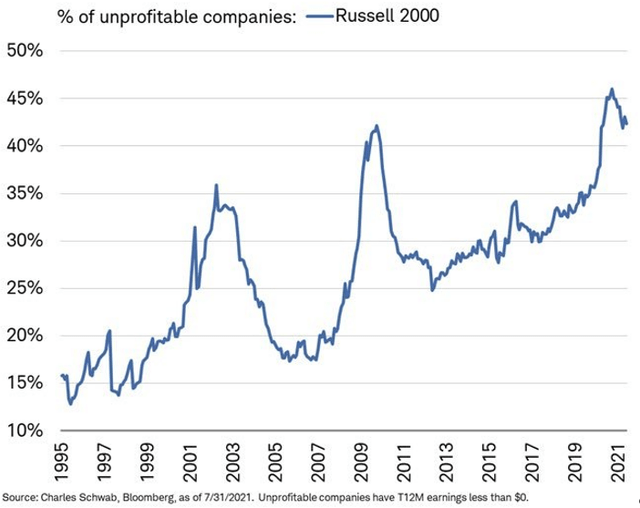
In addition, according to Eagle Asset Management, at the beginning of 2021, only 7% of the companies in the index (Russell 2000) have shown a) significant earnings growth, b) low debt and operating efficiency, c) good return on equity and high return on invested capital over the last 10 years – it is this 7% of companies that have brought 79% of all returns over the last decade. So with the Fed expected to raise interest rates, it’s no surprise that the Russell 2000 is falling so low – much lower than the S&P 500 Index:
Author’s calculations (Investing.com)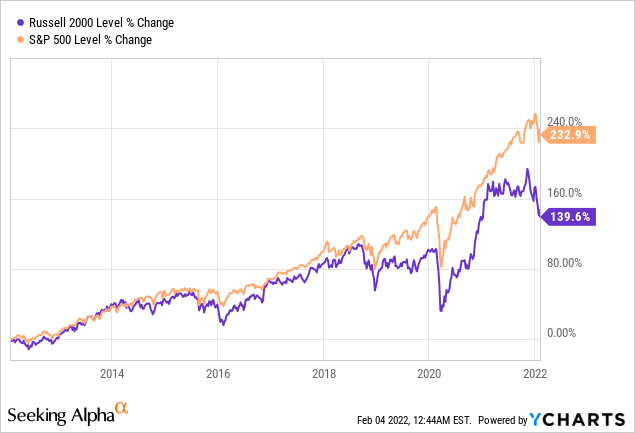
Such a strong historical discrepancy between the S&P 500 and the Russell 2000 could possibly indicate that the S&P 500 will soon follow the Russell 2000 – this will be the case if the historical correlation between these two indexes still makes sense (according to Otavio Costa, Crescat Capital’s Portfolio Manager).
In addition to the actually quite high P/E ratio, the Russell 2000 Index also has a high P/S multiple – due to the lack of a sufficient number of profitable companies, in my view, the Price-to-Sales ratio looks even more important than P/E in this case.
The price-to-sales ratio has been the most accurate gauge of the IWM’s true value as measured by its correlation with subsequent returns in the past, and even with the double-digit price decline and a recovery in sales, the figure remains in the top 10th percentile of valuations going back 25 years.
The current price-to-sales ratio is consistent with 5-year nominal total returns of negative 3-4% per year based on the correlations over the past 25 years. This chimes with the most recent GMO forecast, which as of December 31 puts the 7-year real total return at -6.5%.
Source: Taken from Stuart Allsopp’s Seeking Alpha article dated Jan. 21, 2022
Based on the above, I would not recommend buying IWM on the drawdown due to unremarkable fund management, high commissions, and general overvaluation of index components.
The Main Risk To My Thesis
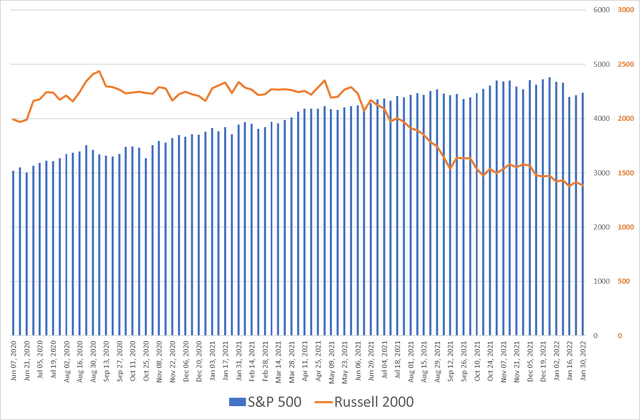
I admit that I could be wrong in my conclusion because we are seeing hedge fund inflows into Russell 2000 companies increasing and already reaching the volume of last March:
Bloomberg data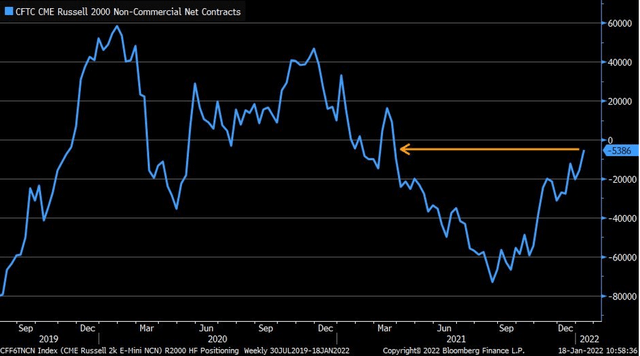
The funds may expect a significant recovery in the U.S. economy in the middle of the first half of 2022 (or earlier), which may indeed be true. However, if we look at what the most profitable Russell 1000 were in 2021, we see a large number of small-cap techs that currently continue to fall.
Charlie Bilello on Twitter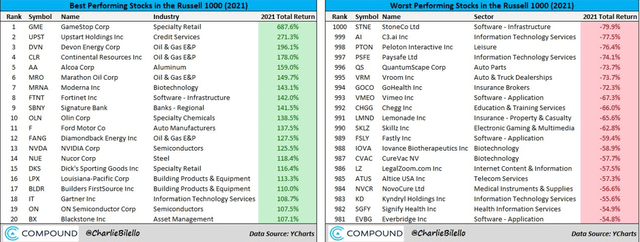
Key Takeaway
In my opinion, it is best to focus on the individual names in the above list for now and try to find really promising fallen angels. And even if you want to allocate some capital to “the broad market” of small-cap companies, the IWM is clearly not the best option out there.
Overall, I expect the Russell 2000 Index to renew its local bottom as stock market liquidity shrinks. IWM is likely to show the lowest relative return among other ETFs tied to this index (due to higher commissions), even if I turn out to be wrong in my expectations. So I do not recommend allocating any capital to this particular ETF.
Happy investing and stay healthy!
[ad_2]
Source links Google News