")
[ad_1]
 (Source: Google Images)
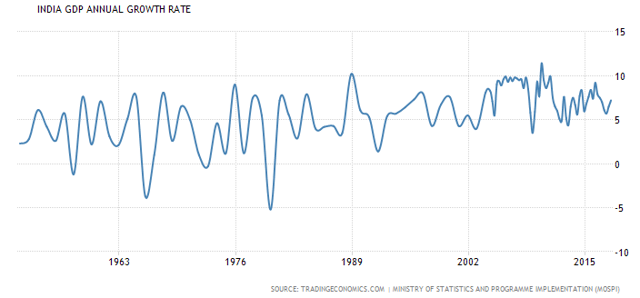
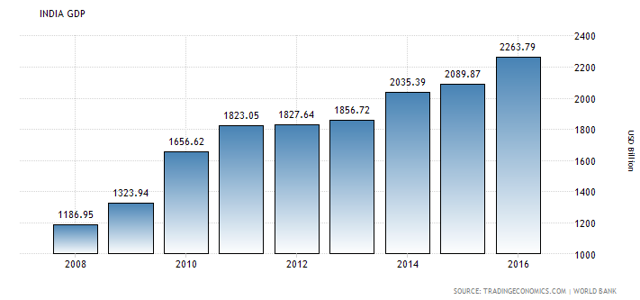
India will be the world’s fastest growing economy in 2019 with an expected growth rate of 7.3%, according to the IMF. The GDP of India has almost doubled post the global financial crisis and is likely to double again to become $5 trillion in the next decade.
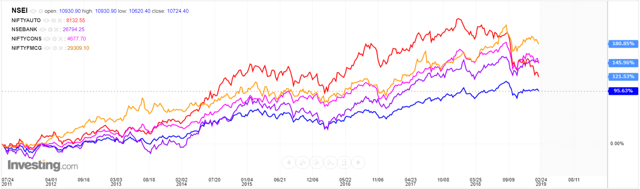
The current bull run in India is led by sectors like FMCG, consumption, automobiles and financial services. Most of the companies in these sectors are high quality in nature with high visibility of quarterly earnings; many investors and fund managers have positioned themselves in this segment of the market in order to hedge themselves against the rising volatility.
However, the entire hypothesis of consumption growth given India’s demographics is under scrutiny recently as auto sales recorded the worst fall in nearly eight years. The FMCG sales for the first quarter slowed down to 13.6% from 16% a year ago, leading the management of Hindustan Unilever use the word ‘recession’ in the press briefing when the company posted slowest volume growth in the last six quarters.
Most fund managers have completely ignored the capital-intensive sectors like realty, metals, infrastructure, energy and utilities, that have under-performed drastically in the current bull run. The BSE Realty Index is down 86%, BSE Power Index is down 60% from its 2008 peak and Nifty Infrastructure Index has given negative returns since inception in 2010 and rightly so.
One of the reasons that the old economy (capital-intensive) stocks have under-performed in this bull run is India’s high real interest rates (10-year G-sec yields around 7% while CPI is at 2%). In times when real rates are negative across most developed economies, India has one of the highest real rates in the world. Things are likely to change going ahead as the new central bank governor has cut interest rates in his first meeting, going against the consensus view and subsequently as well.
Secondly, all these sectors have much higher government intervention and regulations. India went through a policy paralysis during the previous government regime, which had negative implications for all these sectors. The new government’s reforms like the Goods and Services Tax (GST), Real Estate Regulatory Act (RERA), Insolvency and Bankruptcy Code (IBC), etc. are historic in nature and its impact would be realized over the next decade. We are already witnessing the impact of the policy measures in India’s continuous rise in the Ease of Doing Business Rankings, placing India in the list of top 10 recipients for FDI inflows.
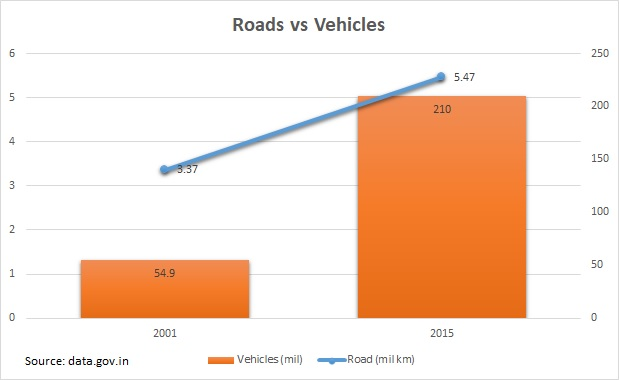
India’s current electricity consumption per capita is less than half that of global average, 25% of China’s and 10% of the US’s. As all villages and households have access to electricity, India’s per capita consumption will reach the global average in the coming decade and the country will need to add as much capacity as it had already built since its independence in 1947. Total road length in the country has increased by 62% in 15 years, during which the total vehicles have increased by 282%. India desperately needs more investments in roads and public transport. Airlines in India catered to 120 million passengers from 100 airports using 500 aircraft in 2017 but they have already placed orders for over 1000 new aircraft as India has emerged as the fastest growing aviation market.
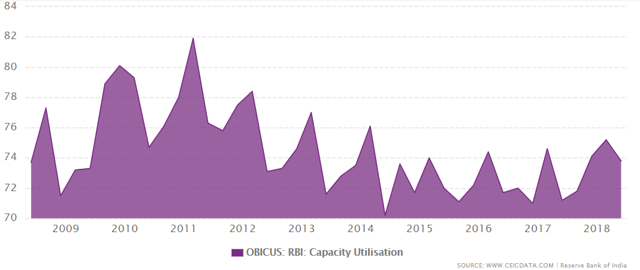
The current economic growth is led by consumption rather than investments as capacity utilization is relatively lower. Over the last few years, capacity utilization has started to inch up with growing demand. It is highly likely that investments will start to increase as utilization reaches near the 80% mark in a relatively lower interest rate environment. We are likely to witness a lot more headlines in future like ‘India pips Japan to be second-largest global steel producer’.
I believe the time for India to become the leader of global growth for the next decade has finally arrived. At a time when most investors have positioned themselves to participate in the Indian consumption story, I believe it is about time to reconfigure your portfolio to participate in the infrastructure story of India.
Columbia India Infrastructure ETF (INXX) tracks India Infrastructure Index which comprises of a portfolio of 30 stocks from the infrastructure space and is broadly diversified across sectors like utilities, industrial, metals, telecom, energy and real estate. Typically, it includes leading companies from all sectors which have under-performed in the current bull run. This ETF was launched in 2010 and has an expense ratio of 0.76%. It is trading at a P/B of 1.48 and trailing P/E of 14.84, whereas the Columbia India Consumer ETF (INCO) trades at a P/B of 4.5 with a trailing P/E of 30.54.
Economic Landscape
India is on a growth trajectory not only today or in this decade but ever since its independence. Being a diverse country and coming out of an era of darkness was indeed a major challenge for this new democracy in initial decades. However, it made a slow and steady progress over the years and will become the fifth largest economy in the world by the end of this year.
Investors have been handsomely rewarded as well along the way. The BSE SENSEX was created in 1979 with a base of 100 and it reached 40,000 this year, i.e. a CAGR of over 17% returns in rupee terms and over 11% in dollar terms.
The future growth outlook is well intact as well given the demographics of the country. According to a Morgan Stanley (NYSE:MS) report, India is likely to become a $6 trillion economy and the third-largest economy in the world, only behind the U.S. and China by 2027.
Current Market Texture
After the global financial crisis of 2008, Nifty 50 Index was around 3,200 levels in April 2009 and this, it reached 12,000 levels for the first time in its history, i.e. a CAGR of 13.9% returns (ex-dividends) in rupee terms.
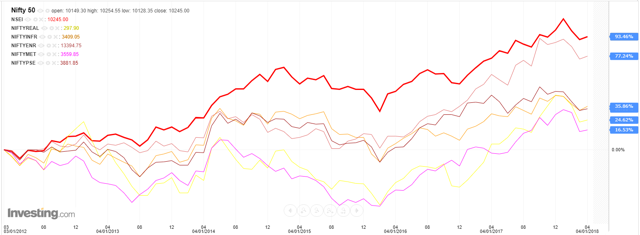
The current bull run in the market is led by sectors like automobiles, financial services, FMCG and consumption related stocks as can be seen in the following chart. All these sectors have handsomely outperformed the benchmark Nifty 50 index by up to 85% over the last few years. The good part of the current bull run is that only the high-quality companies with debt-free balance sheets, high return ratios and strong free cash flows have led the indices higher.
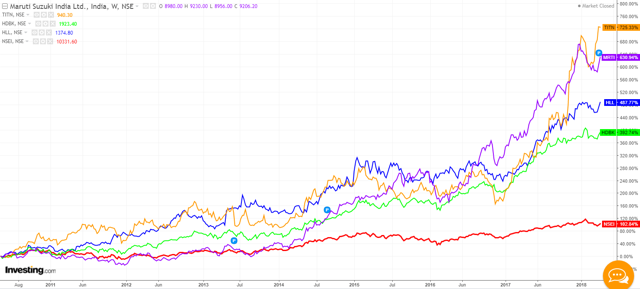
The Indian markets are an oasis of multi-baggers and an absolute delight for any stock picker. Not only the small and midcaps have delivered fantabulous returns, some of the largest market capitalization companies have multiplied in the current bull run. Stocks like Hindustan Unilever, the leading FMCG company in India; Maruti Suzuki (OTCPK:MRZUY), the leading car manufacturer with 50% market share in India; The Titan Company, lndia’s leading watch and jewellery retailer and HDFC Bank (NYSE:HDB), the largest bank by market capitalization, all have over $10 billion in market cap and have delivered an alpha of anywhere between 3x and 6x in the current bull run, which can be seen in the following chart.
And there are stocks from the mid-cap universe like Bajaj Finance and Eicher Motors, which are up over 50x in this period. What has happened in the current bull run is that many of these consumption-related stocks are trading at their all-time high valuations. Stocks like Avenue Supermarts and Jubilant FoodWorks (till recently) are trading at price earnings multiple in triple digits, which reminded me of Japan in early 1990s. I am sure we are aware of what happened to NIKKEI 225 after that; it is still down 40% from its peak after almost three decades. I am not suggesting for a moment that these stocks will have similar fate. But typically, higher realized returns for existing investors could possibly result in lower future returns for new investors in the long run.
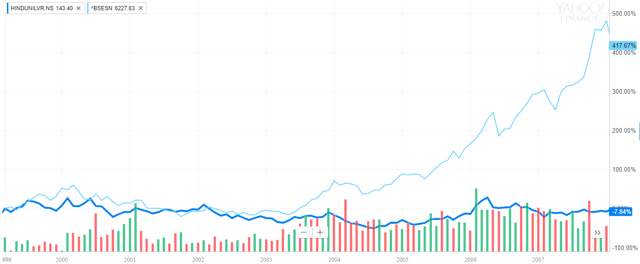
Even if we assume that Japan was an exception, let us look at a classic time correction case from India. Hindustan Unilever grew its net income from ₹1.3 trillion in 2000 to ₹1.92 trillion in 2007, i.e. a 47% growth. Look at the chart below and see what happened to its stock price over that period. While the benchmark index, BSE SENSEX went up 4x, Hindustan Unilever, which is the bluest of the blue chip in the Indian markets, was marginally lower almost after a decade, despite growing its sales, profits and dividends.
Old economy sectors like realty, infrastructure, energy, metal and public sector enterprises have drastically underperformed over the past decade as shown below. For example, the BSE Power Index is down over 60% and BSE Realty Index is down over 85% since their peak in January 2008.
Infrastructure Situation
Goods and Services Tax is by far the biggest indirect tax reform in the country, which has unified the country by eliminating multiple state and local taxes, making movement of goods seamless across states. Media reports have started to recognize the positive impact of GST on the economy. Insolvency and Bankruptcy Code (IBC) is likely to resolve 12 large bad accounts from power, steel and infrastructure sector, freeing up assets worth over $50 billion in 2019 and leading a stronger financial system. Real Estate Regulatory Authority (RERA) has stringent guidelines for the real estate developers, which will ensure that marginal and smaller inefficient players will shut shops or become more efficient. It is more likely to result in consolidation in the real estate industry with larger players with stronger balance sheets and exceptional executional capabilities gaining market share over a period of time.
Capacity utilization in India is inching higher over the past few years and is likely to do so in future as well. Let’s look at the current situation across various sectors.
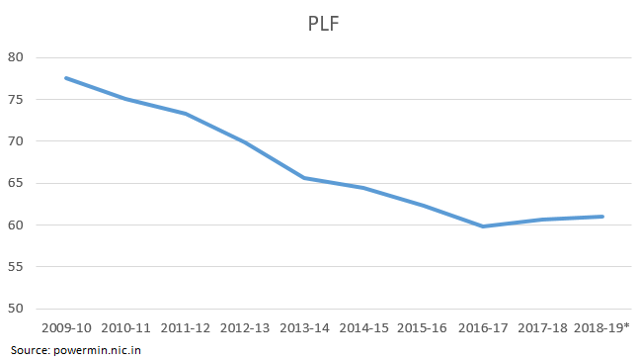
Power: India is the world’s third-largest producer and consumer of electricity. However, its per capita electrical energy consumption is only 1,122 KWH, in comparison to the global average of 2,674 KWH with China at 4,475 KWH and United States at 12,071 KWH. India would need to at least double its current generation capacity if its energy consumption reaches the global average over the next decade. It means that India would need to install as many new power plants (thermal, renewable or hydro) as it already has built till date in the next decade or so. With almost no new thermal power plant capacity addition in the last 5 years, the plant load factor (PLF) seems to have bottomed out in 2016-17 as shown below. Seventy years since independence, India has yet to achieve 100% electrification for its households, which is likely to happen sometime this year. Most investors are bullish about consumer appliances stocks and only a few are participating through power generation, transmission and utilities which are trading near all-time low valuations which are likely to benefit drastically with increase in PLF and lower interest rates.
Coming to the roads sector, total road length in 2001 was 3,373,520 km and in 2015, it was 5,472,144 km, i.e. a growth of 62% in 15 years. On the other hand, total registered motor vehicles were 54.9 million in 2001 vs. 210 million in 2015, i.e. a growth of 282%. India desperately needs more roads to cater to the number of motor vehicles. Anyone who has traveled on city roads would vouch for that.
And there are similar stories in other infrastructure areas as well – be it ports, airports or telecom. India has around 400,000 mobile towers compared to China with almost 1.8 million and the US with 215,000. Deloitte estimated India would have 1.2 million towers by 2020. An average Indian guzzled more data on his or her smartphone than an average British, South Korean and French. India would need more telecom infrastructure as well, be it in optical fibre network or mobile towers.
Consumption vs. Infrastructure
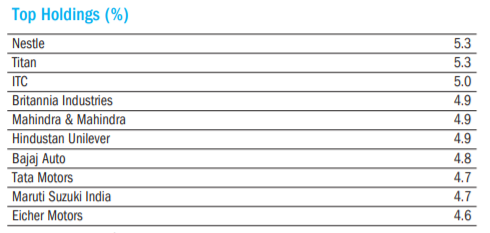
Columbia India Consumer ETF tracks Indxx India Consumer Index which is a portfolio of 30 free float adjusted market-cap weighted index of consumer-facing stocks both from the discretionary and staple universe. The portfolio comprises of high-quality companies and includes some of the leading consumer brands in India. The ETF was launched in late 2011 and currently charges 0.76% in expense ratio. It is trading at a P/B of 4.5 and P/E of 30.54 with a median market cap of $7.2 billion.
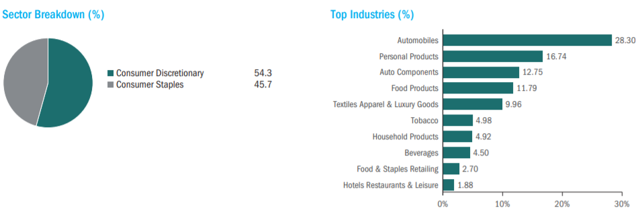
(Source: Prospectus)
Most of the stocks in the portfolio are defensive in nature and have low betas – Nestle: 0.95, Hindustan Unilever: 0.69, ITC: 0.83, Britannia: 0.59, etc. Despite that some of the stocks have declined significantly in the last year or so. Mahindra & Mahindra, Maruti Suzuki, Eicher Motors and Tata Motors (NYSE:TTM) are down around 30% to 40% over the last year while the Nifty 50 Index was up 5%.
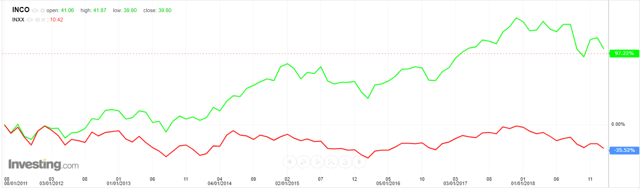
Columbia India Infrastructure ETF tracks Indxx India Infrastructure Index which comprises of a portfolio of 30 stocks from the infrastructure space and is much more diversified in comparison to INCO. This portfolio has holdings in utilities, industrial, metals, telecom, energy and real estate. Basically, it includes leading companies from all sectors which have under-performed in the current bull run. This ETF was launched in 2010 and has an expense ratio of 0.76%. It is trading at a P/B of 1.48 and P/E of 14.84 with similar median market cap companies as INCO. Most of the constituents are high beta and cyclical in nature.
Although both of them are India-specific ETFs yet INXX is down 35% in the last 7 years while INCO has risen above 97% over the same period. This trend can continue in the short term, i.e., 6 to 12 months. However, I am reasonably certain that the next 3 to 5 years are likely to be very different.
 Both the ETFs have certain risks associated with them which an investor should be cognizant of. The foremost risk is the emerging market/foreign market risk, which includes currency risk, liquidity risk, small or mid-cap size companies (compared to its US peers), political and sovereign risk.
Bottom Line
Indian GDP rose 3.6x from $462 billion to $1.66 trillion between 2000 and 2010, led by infrastructure boom. If this cycle were to repeat itself again, Morgan Stanley’s prediction of $6 trillion Indian economy by 2027 would most likely come true.
Hence, it might be a good time to be a contrarian today. Allocating fresh funds in sectors that haven’t done well in the past like INXX and booking profits from sectors that have done well like INCO might turn out to be a prudent strategy over the next few years.
Disclosure: I/we have no positions in any stocks mentioned, and no plans to initiate any positions within the next 72 hours. I wrote this article myself, and it expresses my own opinions. I am not receiving compensation for it (other than from Seeking Alpha). I have no business relationship with any company whose stock is mentioned in this article.
[ad_2]
Source link Google News