[ad_1]

Sezeryadigar/E+ via Getty Images
Value stocks are about as exciting as watching grass grow, but have you ever noticed just how much grass grows in a week? – Christopher Browne
Patrons of The Lead-Lag Report would be well aware of my predilection towards international markets in 2022; over the past couple of months, I’ve highlighted the attractive prospects of international stocks across various sections of my paywalled research report. In keeping with my general sense of optimism for this group, I’d like to put forward the iShares MSCI EAFE Value ETF (EFV), a product designed to cover a broad range of value-based stocks from markets such as Europe, Australia, the Far East, and Asia. EFV is a $15.7bn worth ETF and its track index- the MSCI EAFE index attempts to cover nearly 500 stocks that exhibit qualities such as low price to book value, high 12-month forward earnings to price, and high dividend yield.
Why EAFE
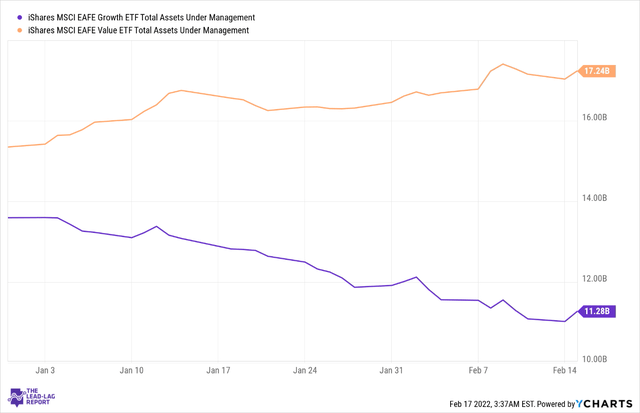
If you follow The Lead-Lag Report on Twitter, you’d note that long-term mean-reversion is something I’ve often highlighted in my posts; after years and years of underperformance, I believe we may now well be in the throes of a broad global shift from growth to value stocks. One can certainly already get a sense of this in the respective AUM trajectories of EFV and the iShares MSCI EAFE Growth ETF (EFG). Since the turn of this year, EFG has seen its total AUM come off quite significantly from levels of close to $14bn to around $11bn; meanwhile, EFV’s AUM has steadily expanded and is above the $17bn mark.

YCharts
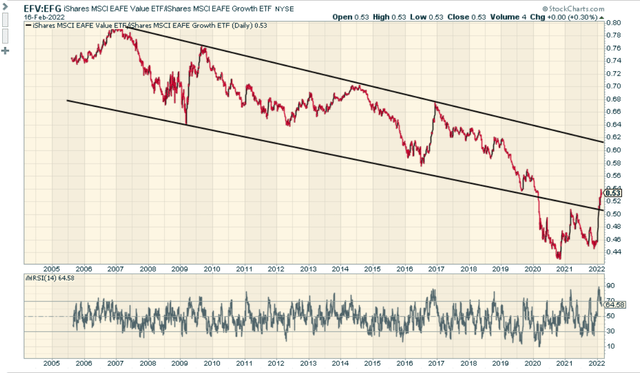
There’s the tendency to think that this move may largely already have played out but I don’t believe that to be the case. To get a sense of how these two ETFs are positioned, one can look at the relative strength ratio of EFV: EFG. Note that value stocks have lost ground to growth stock for over 16 years as this ratio has trended lower in a shape of a channel. During the pandemic, there was another brutal leg down as the ratio dropped well below its long-term channel. In 2022, we’ve seen the ratio bounce back to the old channel (meaning strength in value stocks ahead of growth), but note that it still has plenty of room left to hit the upper end of the channel (meaning further potential outperformance of value over growth).

Stockcharts.com
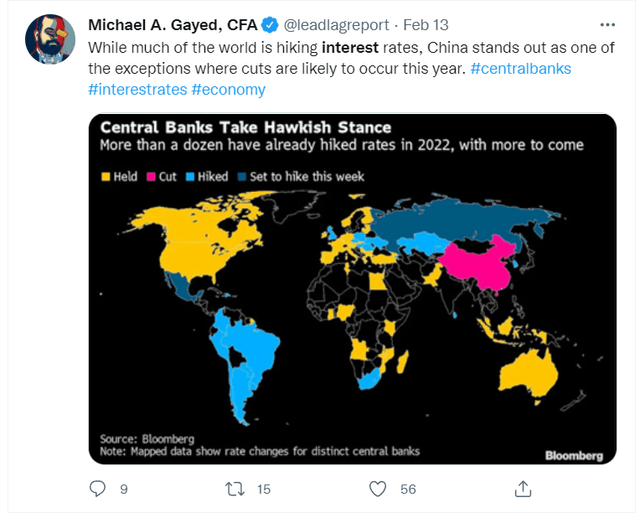
So what’s driving this shift you ask? There are many reasons for this but I’d like to believe that the trajectory of global interest rates may be playing a crucial role in driving the narrative. For years, we’ve had the tap of easy money turned on, and investors have been fairly sanguine about the cost of capital they’re willing to consider to back these growth names. Now, as pointed out in an infographic shared on the timeline of The Lead-Lag Report, globally we’ve seen quite a sharp pivot towards a tighter interest rate environment. As central bankers across the world tighten or get ready to tighten rates, the risk premium associated with these growth names goes up; in effect, the future cash flows of growth stocks get discounted at a far higher rate relative to value stocks.

Rising interest rates bodes particularly well for something like an EFV, as the financials sector accounts for the largest share of the portfolio by far at 26.5% (the next largest sector weight is more than 1500bps lower). A lot of these financials have found it hard to expand their net interest margins in the previous era of easy money and after having bottomed out, NIMs look well set to re-test previous highs. With global inflation showing no signs of bottoming out as yet, rates are poised to increase even further.
You also have to consider that investors have also recently been gravitating to stocks with strong dividend profiles. A lot of these global financial stocks that make up EFV have excess capital sitting on their balance sheet (these entities followed good risk management practices and built-up strong buffers of capital to cope with a potentially weak credit environment). Credit-related issues haven’t been as bad as initially feared and this excess capital could find its way to shareholders’ pockets by way of higher dividends or buybacks.
Perhaps if there’s one less-than-ideal facet of EFV, it is its exposure to the Japanese region where stocks based here account for the largest share at 22%. Growth here remains stagnant, and as mentioned in The Lead-Lag Report, the Bank of Japan remains one of the major outliers amongst major developed markets central banks as it continues to engender loose monetary conditions even as the rest of the world is tightening. Its most recent attempt at yield curve control is to try and buy an unlimited amount of 10-year Japanese bonds at 0.25%.
Conclusion
Besides ongoing momentum, what also works for EFV is the relative differential in value and income. According to YCharts, EFV only trades at a forward P/E of 10.55x, this is almost half the corresponding forward multiple of EFG at 20x. I believe this is quite a steal when you consider that there isn’t much of a difference between the long-term earnings growth potential of the two ETFs (EFG offers forecasted 5-year earnings growth of 13.8% whilst EFV offers a corresponding figure of 12.6%). You also get the benefit of a much superior yield with EFV offering a yield of nearly 4% as against EFG’s figure of only 1.6%.
 Anticipate Crashes, Corrections, and Bear Markets
Sometimes, you might not realize your biggest portfolio risks until it’s too late.
That’s why it’s important to pay attention to the right market data, analysis, and insights on a daily basis. Being a passive investor puts you at unnecessary risk. When you stay informed on key signals and indicators, you’ll take control of your financial future.
My award-winning market research gives you everything you need to know each day, so you can be ready to act when it matters most.
Click here to gain access and try the Lead-Lag Report FREE for 14 days.
[ad_2]
Source links Google News

