
syahrir maulana/iStock via Getty Images
Background
We use the following market sector dashboard to put our finger on the pulse of the market and its major sectors. Especially, the simple YS (yield spread, defined as the TTM dividend yield minus the 10-year treasury rates) is the first thing we look at. They give us a 30,000 feet view of where to look further – which sector, growth stocks, value stocks, bonds, or precious metals, et al. We will detail the meaning of each entry in the next section, and we update the dashboard monthly. Feel free to download or export the google-sheet via the following link too: Market Sector Dashboard.
Author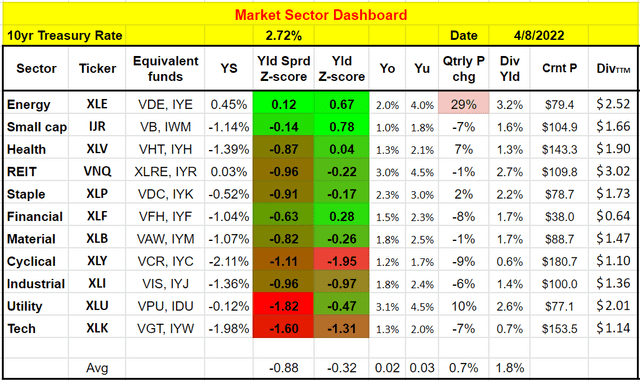
Thesis and highlights
A few overall impressions and highlights on the market and the small-cap sector this month:
- Firstly, the results and dashboard apply to several of the popular small-cap ETFs, such as the Vanguard Small Cap ETF (NYSEARCA:VB), the iShares Russell 2000 ETF (NYSEARCA:IWM), and also the iShares Core S&P Small-Cap ETF (IJR). The reason is that these funds are quite similar and their valuation is closely correlated as you can see from the second chart below. As such, this article will present the results for VB and IWM, but the results should be applicable to all similar funds.
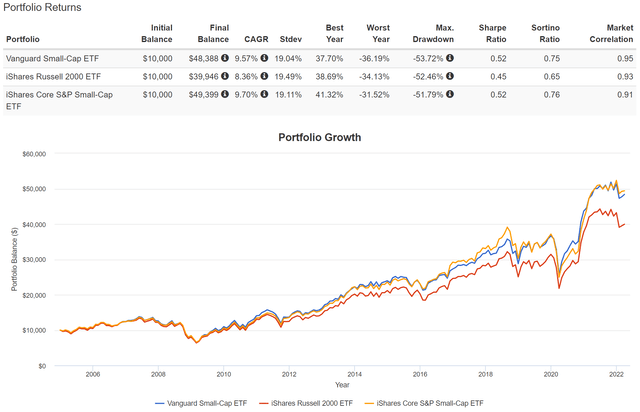
- The correlation between VB and IJR is especially close. Their performances overlap with each other essentially entirely. IWM has underperformed the other two funds in the past by a small margin. Part of the reason is that IWM is a more expensive fund. It charges a 0.19% expense ratio compared to a 0.05% expense ratio from VB. Such a small difference, when accumulated over a long period of time, becomes more dramatic.
- The yield spread between these small-cap ETFs and the risk-free rates is currently below their historical level by a good margin. With a YS Z-score that is significantly negative (-0.14 as represented by IJR), these funds are substantially overvalued compared to their historical spectrum.
- The rapid rise of treasury rates has made the yield from these funds unattractive. The 10-year treasury rates just surged above 2.7% for the first time since 2018 and are expected to rise further based on the latest Fed dot-plot.
- The energy sector is the only sector that currently features a positive yield spread Z-score.
With the above overall discussion, we now move on to the specifics of the dashboard, VB, and IWM.
ETF.com Source: Portfoliovisualizer.com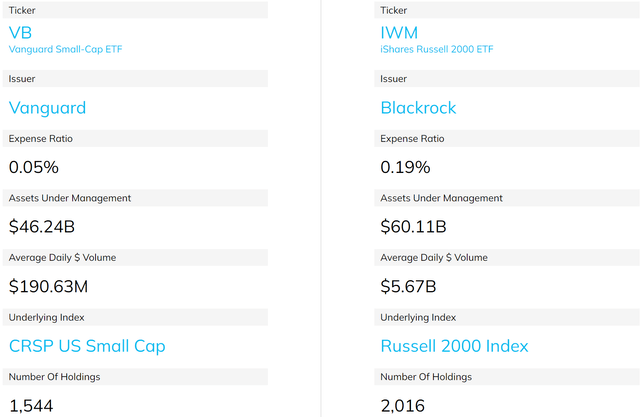
The dashboard explained
Note: if you are familiar with our Market Sector Dashboard already, you can skip this section. It describes the mechanics of the dashboard.
- The yield spread Z-score. It gauges the dividend yield of a given sector relative to the 10-year treasury rates. How the yield spread is calculated will be detailed in the next section. A larger Z-score suggests larger undervaluation compared to the historical record and treasury rates. And vice versa.
- A Z-score that is closer to 1 means the yield spread is near the thickest level of the historical spectrum and is color-coded by bright green. And vice versa.
- The yield spread Z-score. Similar to the yield spread Z-score, it gauges the dividend yield of a given sector relative to its own historical record. A larger Z-score (greener) suggests a larger undervaluation compared to its own historical record. And vice versa.
Yield spread and yield spread Z-score
For bond-like equities fund VB and IWM, an effective way to evaluate their valuation with interest rates adjusted is to calculate the yield spread. Details of the calculation and application of the yield spread have been provided in our earlier article. The yield spread is an indicator we first check before we make investment decisions. We’ve fortunately had very good success with this indicator because of:
- Its simplicity – it only relies on the most simple and reliable data points (treasury rates and dividends). In investing, we always prefer a simpler method that relies on fewer and unambiguous data points rather than a more complicated method that depends on more ambiguous data points.
- Its timeless intuition – no matter how times change, the risk-free rate serves as the gravity on all asset valuations and consequently, the spread ALWAYS provides a measurement of the risk premium investors are paying relative to risk-free rates. A large spread provides a higher margin of safety and vice versa.
With this background, you will see below that when adjusted for interest rates, their current valuations are not at an attractive level.
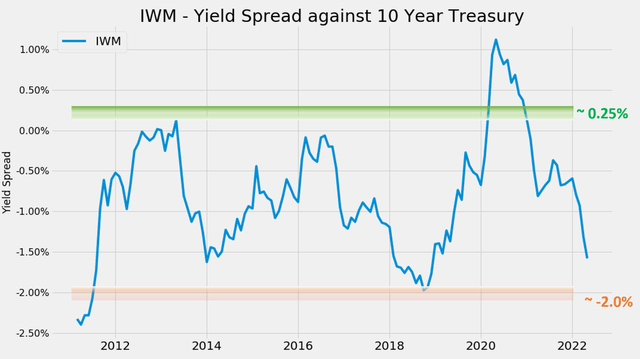
Take VB as an example. The following chart shows the yield spread between VB and the 10-year treasury. The dividend yield is calculated based on the TTM dividends. As can be seen, the spread is bounded and tractable most of the time. The spread has been in the range between about 0.50% and negative 1.75% the majority of the time during the past decade. Such a tractable YS suggests that when the spread is near or above 0.5%, VB is significantly undervalued relative to the 10-year Treasury bond (i.e., I would sell treasury bonds and buy VB). In another word, sellers of VB are willing to sell it (essentially an equity bond with growth built-in) to me at a yield that is 0.5% above the risk-free yield. So it is a good bargain for me. And vice versa.
Similarly, you can see that the yield spread between IWM and the risk-free treasury rates is also bounded and tractable. And the bounds are quite similar. The small differences in the bounds are due to the different indexing methods used in these funds. VB holds about 1500 stocks while IWM holds more than 2000.
You can see the screaming signal in 2020 when the yield spread surged to ~1%+ level – and this is why this dashboard is the first thing we look at when we make our investment decisions.
As of this writing, the spread for both funds is substantially below the historical average, signaling an overvaluation relative to risk-free rates.
Author Author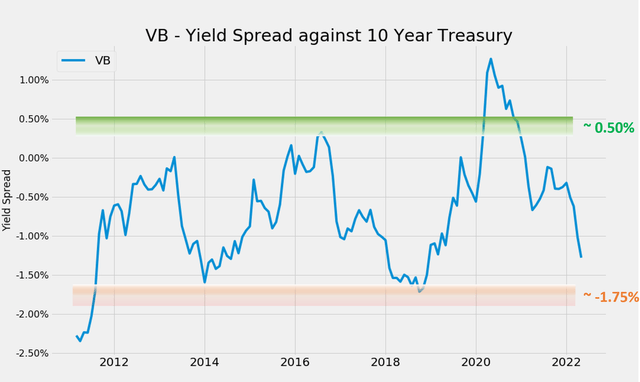
For readers familiar with our analyses, you know that the short-term returns are closely correlated with the yield spread for many of the funds and stocks. And as you can see from the chart below, it is also true for VB. This chart shows the 2-year total return on VB (including price appreciation and dividend) when the purchase was made under different yield spreads. There is a clear positive trend and a Pearson correlation coefficient of 0.65.
Again, the screaming buying opportunities in 2020 are shown by the two data points on the far-right side of the charts. And you see the outsized return in the next 2 years. In general, also shown in the orange box, when the yield spread is above 0%, the total returns in the next two years have been all positive and quite large (almost all above 25%).
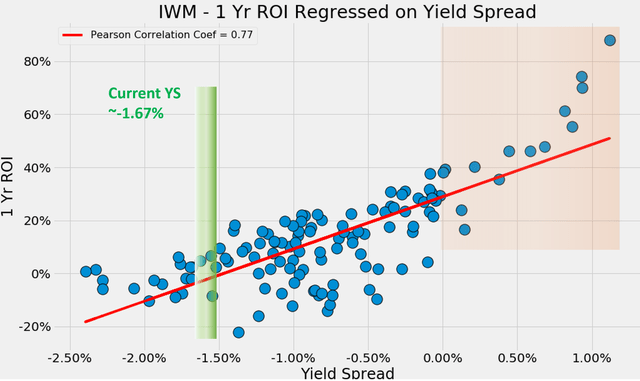
You can see a very similar correlation for IWM, again, because they share a similar underlying indexing approach. Here we are plotting the 1-year return for IWM to show that the correlation holds over a shorter period of time too. For IWM, the positive trend is even stronger and the Pearson correlation coefficient of 0.77. Also shown in the orange box, when the yield spread is above 0%, the total returns in the next 1 year have been all positive and even larger (all above about 20%). And when the yield spread is above 0.5%, the total returns in the next 1 year have also all been about 40%.
As of this writing, the yield spread is about -1.37% for VB and about -1.67% for IWM, respectively. And both are substantially below their historical average.
Author Author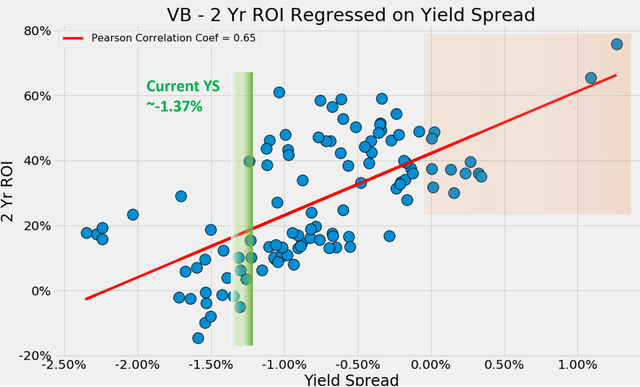
Conclusions and risks
We use a Market Sector Dashboard to put a finger on the pulse of the market and its major sectors. For this month, our key observations are:
- The surging treasury rates act like gravity on all sector valuations, and the small caps are no exception. The yield spread between small-cap ETFs (such as VB and IWM) and risk-free rates have been pushed to be below their historical mean by a significant margin.
- Although small-caps are still the second most attractively valued sector (in relative terms). And currently, the energy sector is the only sector that still features a positive yield spread Z-score.
Before closing this article, we want to point out a few risks and uncertainties associated with the approach described in this article.
First, despite their similarities, these small-cap funds are not exactly the same. As aforementioned, VB holds about 1500 stocks, IWM holds more than 2000 holdings, and IJR holds about 600 stocks. Although they use a similar sampling method to represent the full spectrum of small-cap stocks. And as a result, the valuations of these funds (and therefore their yield spread) won’t be exactly the same but should be quite close.
Second, as detailed in our earlier article, dividend yields do not always reflect business fundamentals due to the following factors:
- Tax law – dividend can change quite a bit depending on whether the tax codes favor it or not.
- Political climate – dividend can also change based on how politically popular it is.
- Composition of the market index – dividend yield of “the market” can also be biased if the index is dominated by a few mega-caps who do not pay dividends – like what we are experiencing now.
- As a result, we do not directly use the yield spread in our investment or asset allocation decisions. In practice, we first adjust for the above corrections and then use the adjusted yield spread in our investment decision. But the data and approach illustrated here is also the first place we check.