[ad_1]
The ETFMG Prime Mobile Payments ETF (IPAY) invests in an attractive market segment, but we’re not sure the .75% expense ratio is justified. Given the simplicity of replicating the fund, we think many investors could do an adequate job replicating it in their own portfolios with a group of individual stocks.
Why the High Expense Ratio?
Here’s our biggest issue with the fund. Why is the expense ratio .75%? The index appears to be straightforward to compile even if a bit difficult to find out exactly what it is. The index website says this – “The Prime Mobile Payments Index is designed to measure the performance of companies engaged in the Mobile Payments industry that have satisfied the eligibility requirements as determined by Prime Indexes.” Not a big help for investors, you have to pull up the complete methodology document until you actually find the specifics.
Here we find that the index is designed to be diversified with individual securities capped at 6% and a cap on the total number of securities that are weighted at over 5%. The rules for inclusion are some of the simplest we’ve seen. To be included in the index, the company must either engage in payment processing services or applications, provide payment solutions, build or provide payment industry architecture, infrastructure or software, or provide services as a credit card network.
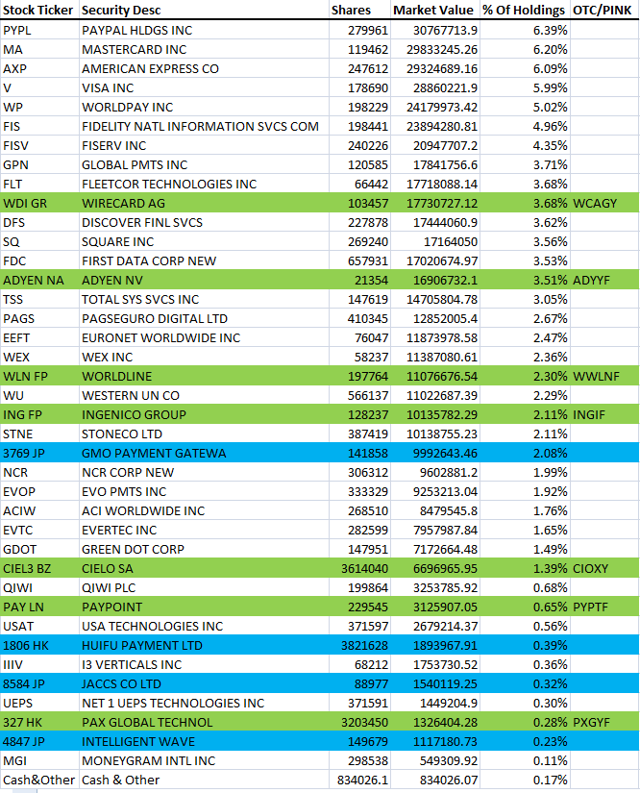
The result is that the index includes pretty much any company remotely related to payments. Below is a table of the fund’s current holdings. We’ve highlighted in green stocks that trade on the OTC or Pink Sheets and highlighted in blue stocks that trade on foreign exchanges (for reasons we’ll discuss later in the article).

(Source: Fund website, highlights author)
One thing that is interesting is that Apple (AAPL), Alphabet (GOOGL) (NASDAQ:GOOG), and Samsung (OTC:SSNLF) are not included despite those companies being involved in payments via Apple Pay, Android Pay, and Samsung Pay. But, all three derive a majority of their income from non-payments related businesses. So, perhaps that’s the reason the index excludes them. The methodology document doesn’t appear to say anything about certain payments related financial thresholds to be met for a company to be considered for inclusion.
It’s also worth noting that there are no Chinese companies like Alibaba (BABA) and Tencent (OTCPK:TCEHY) in the index either. The index methodology appears to exclude many (if not all) Chinese companies because of the following provision:
Exchange Listing Requirement: The component security must not be listed on an exchange in a country which employs restrictions on foreign capital investment such as those restrictions render the component effectively non-investable for a US based fund.
If we are interpreting that passage correctly, it means that because the Chinese companies trade on Chinese exchanges (in addition to some trading on US exchanges) that have certain restrictions on foreign capital investments they are ineligible. It may also be interpreted as having issues with the WFOE/VIE structure that many Chinese companies employ as well. Although, there is no firm definition for what is considered “effectively non-investable.” Whatever the case, you get no Chinese companies, which is fine by us, although you may disagree.
Overall, the index looks very easy to replicate for US investors given the broad inclusion rules. Foreign stocks trading only on foreign exchanges only make up 3% of the fund. If you exclude those stocks plus ones that trade on the Pink Sheets or OTC, you are up to only 17% of the fund. There is also the question of whether or not you really want to own some of the foreign stocks at all. Is Wirecard worth buying given the current issues over accounting and short seller allegations of fraud? Is Cielo a good buy given the political and economic situation in Brazil? US investors can easily buy 83% of the index. Furthermore, the top 10 holdings make up 10% of the fund and the top 20 make up 80%. So, the number of stocks you need to buy is limited. There’s also the possibility to reduce the number further as a lot of the stocks are quite similar. Visa (V) and Mastercard (MA) are likely to perform about the same over the long term. There are also many similarities among the merchant acquirers like Total System Services (TSS), Global Payments (GPN), First Data Corp. (FDC), and others.
Summary
We think investors could easily get something close to the performance of the index by buying just the top ten or so stocks (and possibly eliminating some overlap between similar companies). In fact, when you see our disclosure below, you’ll notice we own a lot of the fund’s holdings as individual stocks in portfolios for our clients. The rules for the index are pretty simple so the stocks included are unlikely to change. The weighting rules favor a diversified portfolio with only a few percentage points difference in the weightings for each stock. We are big fans of the payments space, but we just can’t see the reason for paying .75% annually.
Disclosure: I am/we are long V, MA, PYPL, TSS, GOOGL. I wrote this article myself, and it expresses my own opinions. I am not receiving compensation for it (other than from Seeking Alpha). I have no business relationship with any company whose stock is mentioned in this article.
[ad_2]
Source link Google News

