[ad_1]
Spectacular achievement is always preceded by unspectacular preparation. – Robert H. Schuller
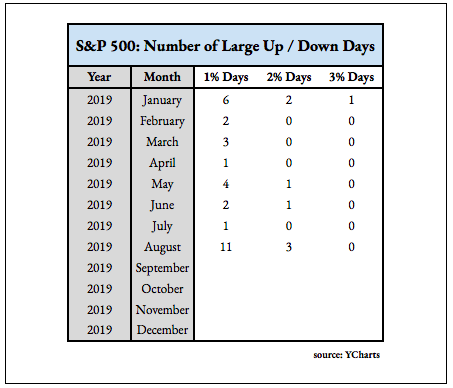
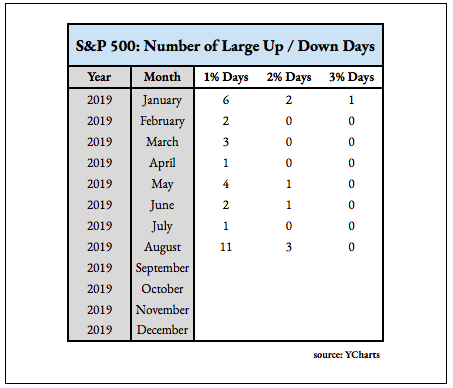
While the direction of the stock market seems to change every week depending on where we stand on trade relations, the one thing that’s become more certain is that volatility is increasing. August has easily been the most volatile month of 2019 and the longest period of sustained volatility since the economy slowed to a crawl back in 2016.
With the economy possibly headed towards recession in the near future, investors have found solace in low volatility stocks. Back in 2017, there wasn’t much need for safer stocks. The entire market was essentially one big low volatility ETF. Investors were able to earn above-average returns by simply taking on market beta risk. 2019 has been a different story.
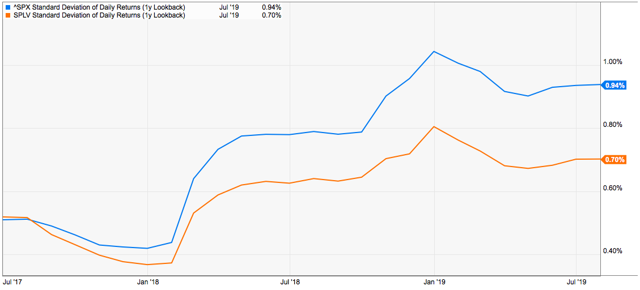
The standard deviation of returns for the S&P 500 (SPY) and the Invesco S&P 500 Low Volatility ETF (SPLV) was identical in the summer of 2017. Today, SPLV comes with about 25% less risk, an important factor to consider as rapidly changing trade market has been whipsawing equity prices up and down quite a bit.
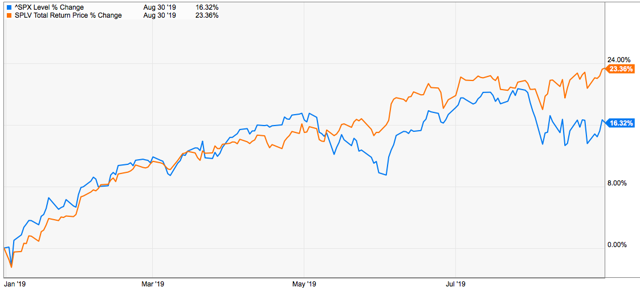
SPLV has been the clear choice for investors targeting this strategy. It’s grown from $8 billion in assets at the start of the year to $12.3 billion today. Part of the attraction, of course, has been its market-beating returns. Year-to-date, it’s beaten the S&P 500 by more than 700 basis points but, more importantly, look at the relatively steady upward trend of the fund.
The market could be headed lower from here as the recessionary signs start getting stronger or it could begin rising back towards all-time highs if the combination of lower interest rates and softening trade tensions do their job. One thing that’s clear is that low volatility stocks will remain in the spotlight for the remainder of 2019.
SPLV may already be on your radar or even in your portfolio, but now’s a good time to examine this ETF because it’s not necessarily a slam dunk choice for low volatility exposure. There are a lot of things to like but also things to watch out for.
Fund Profile
SPLV is benchmarked to the S&P 500 Low Volatility Index, which is comprised of the 100 stocks within the index that have the lowest realized volatility over the prior 12 months. Constituents are weighted relative to the inverse of their corresponding volatility, with the least volatile stocks receiving the highest weights. The fund is rebalanced and reconstituted quarterly. It’s an outlier in the equity ETF universe in that it makes dividend distributions monthly.
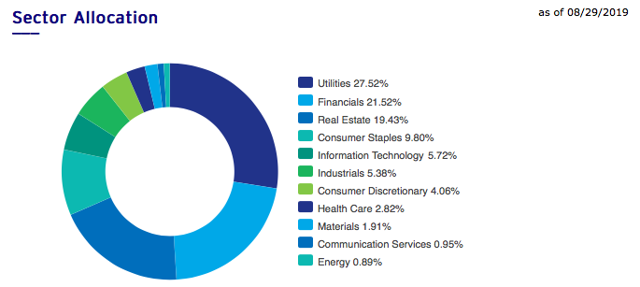
The fund’s allocation is largely what you’d expect with the three of the four heaviest weighted sectors being utilities, real estate, and consumer staples. Even though SPLV is volatility-weighted, the frequent rebalancing makes it not that far from an equal-weighted portfolio. The top holding, Republic Services (NYSE:RSG), accounts for just 1.28% of assets overall.
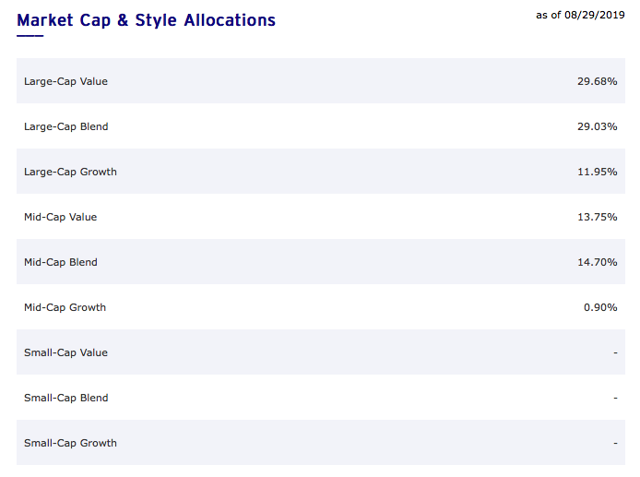
Not surprisingly, there’s very little growth in this portfolio. Nearly 60% of assets fall into the Large-Cap Value and Large-Cap Blend categories. SPLV, thus far, hasn’t been hampered by the fact that the S&P 500 Value Index has trailed the S&P 500 Growth Index by more than 5% year-to-date.
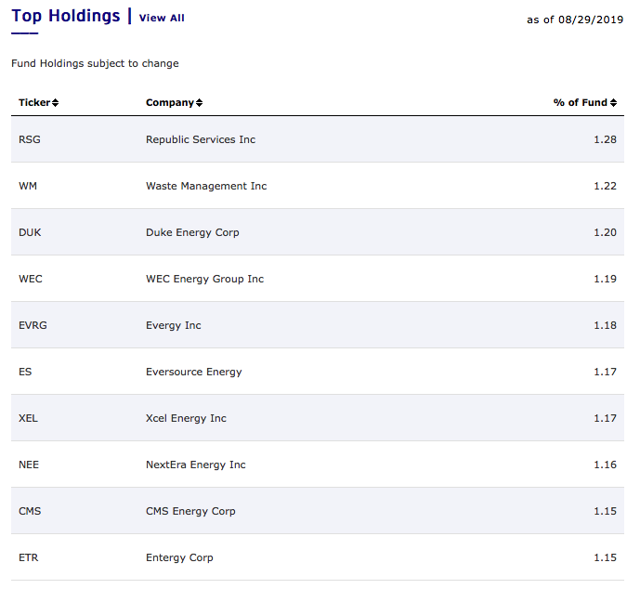
Eight of the fund’s top 10 names belong to the utilities sector with Republic Services and Waste Management (WM) taking the top two spots overall. Again, this fund is very diversified across all of the portfolio’s 100 components, so the top 10 holdings carry less impact in total.
What I Like
The value tilt
Yes, I know that growth has outperformed value consistently over the past several years, but it’s not going to be that way forever. During the decade of the 2000s, the S&P 500 Value Index lost 14% while the Growth Index lost 34%. The 2010s obviously were a different story as that decade was dominated by the longest economic expansion in history. But if a recession is on its way as several indicators are suggesting, now might be a good time to play defense and go with more of a value tilt. At some point, value is going to come back into favor and it might be soon.
The dividend yield
No one is necessarily going to be blown away by a 2.3% dividend yield, but it’s not as bad as it seems on the surface. It’s about 20 basis points higher than that of the S&P 500, and its spread over the 10-year Treasury yield is approaching its highest level since 2016.
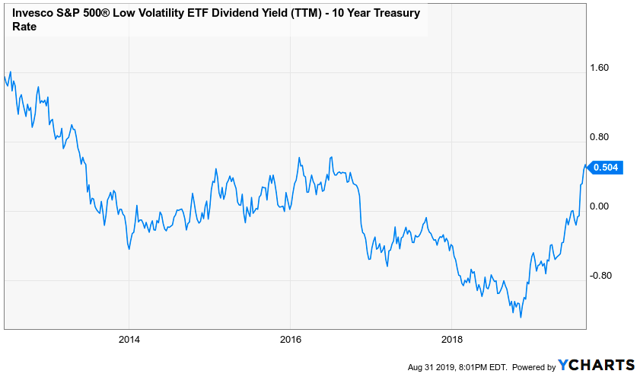
Dividends haven’t been in vogue for some time, but it’s likely to become a bigger component of total return soon. Capturing safe sources of income is a plus for this fund.
What I Don’t Like
The financial sector allocation
Financials may be low volatility stocks but that doesn’t necessarily make them good investments. Margins are getting squeezed at banks and other financial institutions as rates continue dropping impacting their ability to loan money profitably. On the other hand, many of the holdings from the financial sector are insurance companies, not banks. This offers a potentially different interest rate sensitivity profile than if the fund were loaded up strictly on banks. Either way, the fact that 21% of portfolio assets are dedicated to this sector could be a drag on performance.
Expense ratio
At 0.25%, SPLV’s expense ratio is good but not great. Top-performing ETFs, such as the Vanguard Dividend Appreciation ETF (VIG), the Vanguard High Dividend Yield ETF (VYM), the Schwab U.S. Dividend Equity ETF (SCHD), the iShares Core High Dividend ETF (HDV), and the iShares Core Dividend Growth ETF (DGRO), all come with expense ratios of under 0.10%. If you’re choosing this fund, you’re likely doing so for exposure to the low volatility strategy. Just be aware that you won’t be doing it for a bargain-basement price.
Conclusion
Overall, SPLV is a very good choice, if not perhaps even the best choice, for low volatility equity exposure. The blend of traditional defensive sectors like utilities, real estate, and consumer staples coupled with the more conservative names from other sectors within the market give this fund a nice diversified mix that further minimizes overall risk.

Your ability to stick to a strategy matters more than the strategy itself.
The Lead-Lag Report is designed to help you stick to your goals through deep intermarket analysis. My research produces a weekly report that will give you an edge in reading the market for your asset allocation decisions.
You’ll get short, intermediate, and long-term ideas built off of the four award-winning white papers I co-authored on generating alpha and predicting stock market corrections.
Interested? Ignore fake news and get real market analysis.
Try a two-week free trial here and get The Lead-Lag Report today.
Disclosure: I/we have no positions in any stocks mentioned, and no plans to initiate any positions within the next 72 hours. I wrote this article myself, and it expresses my own opinions. I am not receiving compensation for it (other than from Seeking Alpha). I have no business relationship with any company whose stock is mentioned in this article.
Additional disclosure: This writing is for informational purposes only. It does not constitute an offer to sell, a solicitation to buy, or a recommendation regarding any securities transaction. It also does not offer to provide advisory or other services by Pension Partners, LLC in any jurisdiction in which such offer, solicitation, purchase or sale would be unlawful under the securities laws of such jurisdiction. The information contained in this writing should not be construed as financial or investment advice on any subject matter. Pension Partners, LLC expressly disclaims all liability in respect to actions taken based on any or all of the information on this writing.
[ad_2]
Source link Google News

