[ad_1]
AsiaVision/E+ via Getty Images
Is there a tradable bottom in online retail? The Amplify Online Retail ETF (NYSEARCA:IBUY) is in a whopping 64% drawdown off its early 2021 peak above $140. Shares hit a low just above $42 in May, then managed to hold that level on a retest last week. I think shares could be worth a long trade. Still, there’s resistance around $55 based on both near- and long-term price history. Before we dig into the charts, let’s describe what this ETF is and what it holds.
IBUY Drawdowns Since Inception: 2021-2022 Drop Easily the Worst in the Last Six Years
Koyfin Charts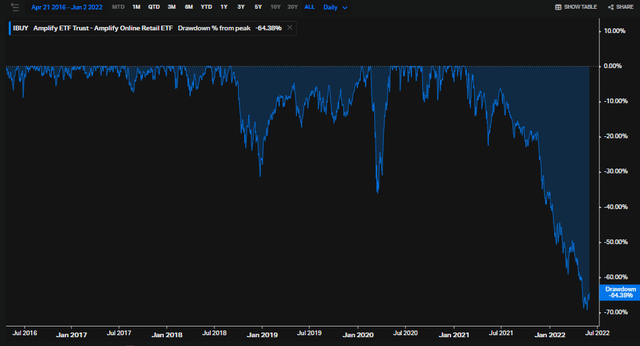
IBUY began trading on April 20, 2016 and has assets of $265 million. With 74 holdings, it’s a diversified online retail fund with an expense ratio of 0.65% that takes a modified equal-weight approach to portfolio management. The bull case is that online retail continues to grow, despite near-term dips as the economy reopens and consumers engage in traditional brick-and-mortar shopping. According to Amplify ETFs, U.S. online retail sales grew at a 20% annual clip from 1999 through 2020.
According to the ETF’s website, IBUY “seeks to provide investment results that, before fees and expenses, correspond generally to the price performance of the EQM Online Retail Index. The Index is a globally diverse basket of publicly traded companies that obtain 70% or more of revenue from online or virtual sales”. The portfolio is composed of mainly U.S. companies (77%).
IBUY Largest Positions
Amplify ETFs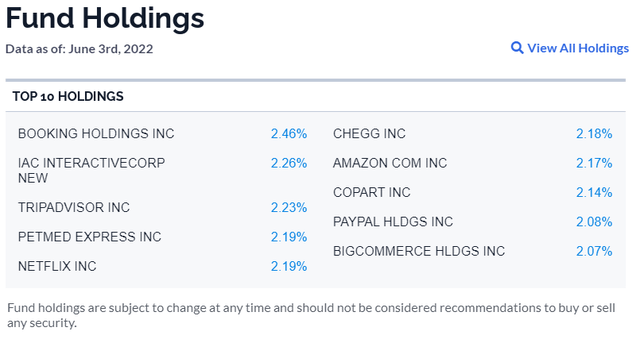
Over the past year, the fund has performed terribly. IBUY is off 60% while the SPDR S&P Retail ETF (XRT) is down just 29%. Retail has been dreadful compared to the SPDR S&P 500 ETF (SPY) which is actually up fractionally from a year ago when you include dividends.
IBUY, SPY, XRT 1-Year Performances
Stockcharts.com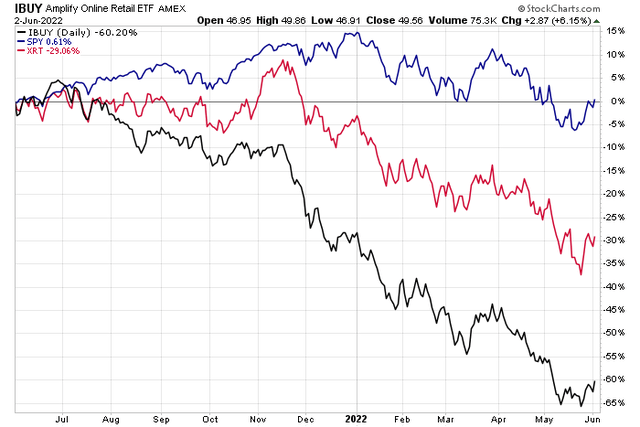
Driving the weak performance is a terrible set of 1-year returns among the fund’s top holdings.
Morningstar: IBUY Top Holdings’ 1-Year Returns
Morningstar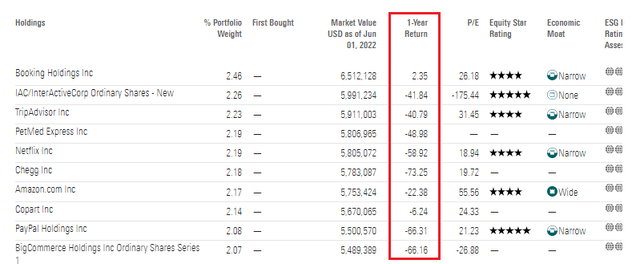
Another analytical tool from Morningstar I am sure to review when analyzing an ETF is the Factor Profile. The Silver-Rated IBUY ETF is a high-growth, low-yield, and low-quality fund, according to Morningstar. Expect big moves and a high beta from IBUY.
IBUY: 3-Year Factor Profile
Morningstar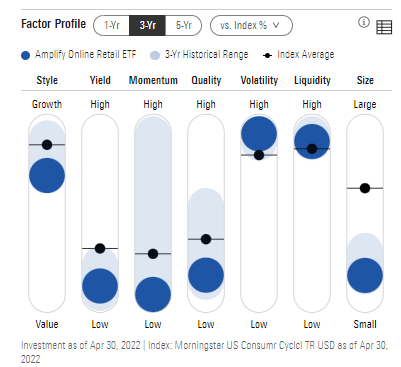
My main bullish case for IBUY is seen in the charts. The fund has round-tripped the climb from $55 pre-pandemic to $140 at the high last year. To be clear, I don’t want to own IBUY long-term until it climbs back above its pre-Covid range highs in the mid-$50s.
IBUY: Long-Term Resistance $55
Stockcharts.com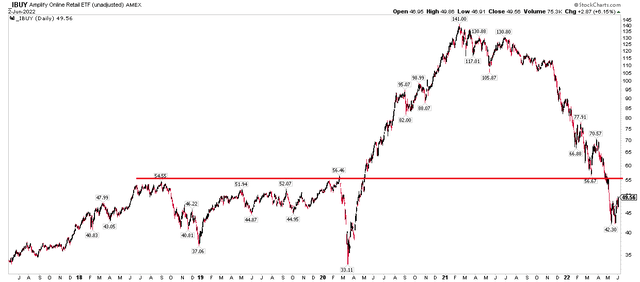
Near-term, however, there is a tradable low via the double-bottom technical pattern from May. Notice how the next upside resistance level has confluence with the pre-pandemic highs. So, my upside target is near $55, offering about 10% upside from here.
1-Year Chart: Bullish Double Bottom
Stockcharts.com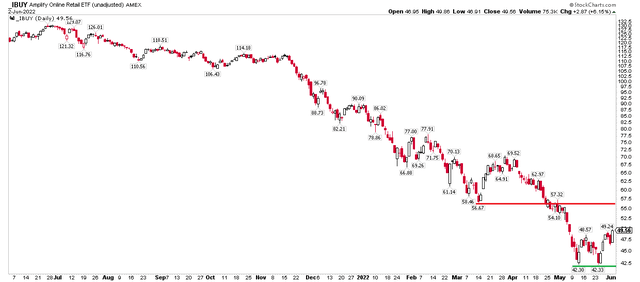
The Bottom Line
Online retail is in a massive downtrend. But within downtrends come counter-trend rallies that offer bulls the chance to pounce. I see that taking shape here with IBUY. Long-term, investors can consider a stake in this online retail ETF once price climbs above $56, preferably on a weekly closing basis.
[ad_2]
Source links Google News

