[ad_1]
JimVallee/iStock via Getty Images
With the market selling off, I was recently asked about buying iPath S&P 500 VIX Short-Term Futures ETN (BATS:VXX) puts. I have long been a proponent of buying VXX puts on spikes in the VXX as a form of income but – to cut to the chase – I do not believe that this current spike in the VXX is a put-buying opportunity. In fact, I would rather advise anyone interested in the VXX – and those interested in hedging further losses in stocks – to take a long strategy in the VXX.
I’ll explain why.
The VXX and SPDR S&P 500 Trust ETF (SPY) Relationship
Last year, I wrote in-depth on the relationship between VXX and the SPY. Specifically, the relationship changes under different volatility regimes. From my last article (emphasis mine):
“Put together, these paradigms show that investors should not expect much during times of low volatility. As volatility rises, it is dangerous to buy dips; you should instead deleverage or hedge. Once VXX has peaked and fallen below its fourth quartile, you should buy the dip, taking profits as VXX makes it way downward.”
Damon Verial; data from Tiingo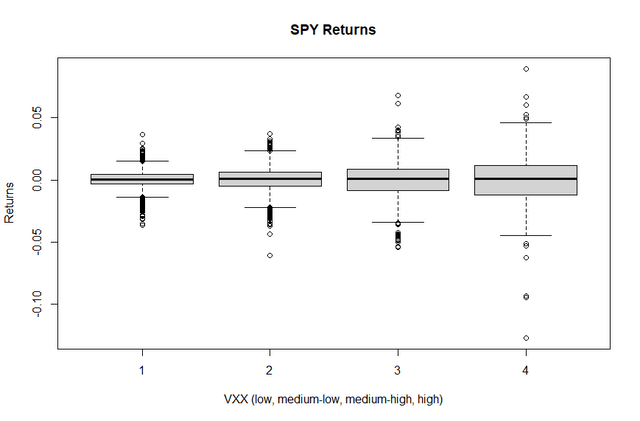
It is tempting to buy VXX puts on spikes – and it works – but the risk/reward turns against you in direct relation to the size of the spike. Buying puts on the VXX on small upward movements is safe and reliable; buying puts on the VXX on large upward movements is neither. In fact, the risk/reward curve favors buying calls, not puts.
To see this in terms of not VXX value but VXX’s logarithmic returns is more useful, in my experience. Here is the VXX’s average daily return for 2021, when market conditions were calm:
Damon Verial; data from Tiingo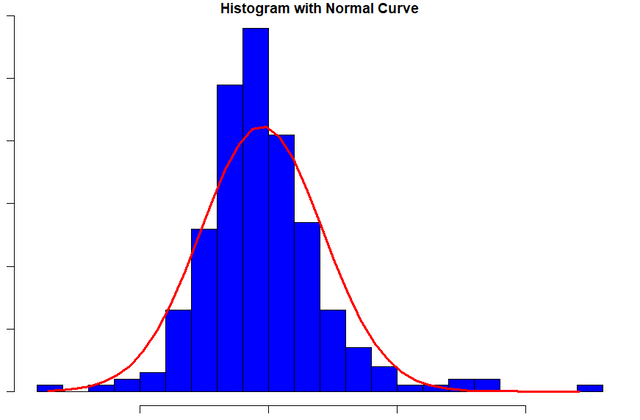
Returns were Gaussian, as expected, but with positive skew (more losses than wins) and long tails on the positive side (large, occasional spikes). Remember, this is how VXX looks under a normal volatility regime. Now, consider VXX’s daily logarithmic returns over the past month, while volatility has been high:
Damon Verial; data from Tiingo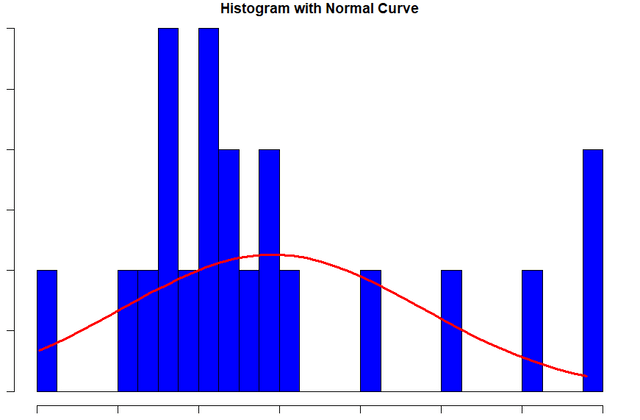
The skew decreases (spikes in the VXX leading to more frequent spikes) and the tails get shorter; returns see frequent deviations from the average. This is commonly seen in momentum patterns. In other words, when volatility is high, volatility tends to continue being high for quite some time.
What Is Going On?
At this point, it is natural to ask: So what does this all mean for the market? And what is causing it?
In short, volatility is likely to remain high for a while. You can read dozens of explanations as for why the market is selling off, from simply being a natural part of the business cycle to political issues. Personally, I am only inclined to believe reasons I can quantify.
A while back, I showed, via hypothesis testing, that volatility and interest rates are undeniably correlated. The theory is that the underlying connection is actually the steepening of the yield curve, which is influenced by economic factors in addition to rising rates.
Damon Verial; data from Tiingo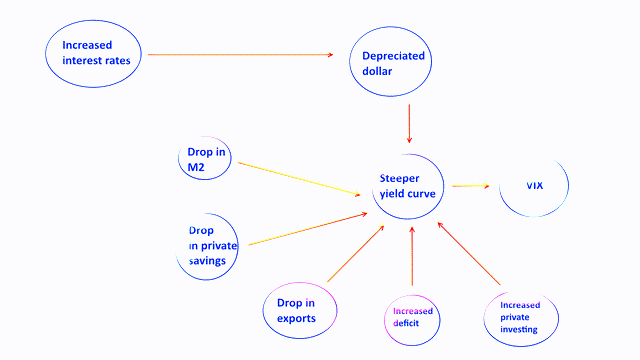
It is thus natural to assume that as the market prices in higher rates, we should see heightened volatility. Considering that the market is pricing in an average target rate 100-125bps by the end of the year, volatility should be higher than it was in 2021:
CME Group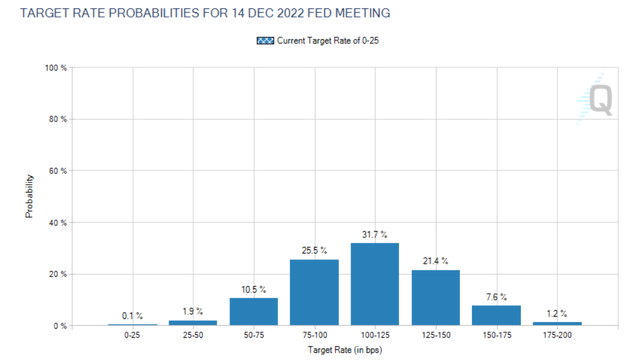
Of course, this applies to the VIX, not VXX, which decays over time due to its construction. But the point remains: The market conditions are putting upward pressure on volatility, and thus volatility ETNs, meaning this is most likely not a put-buying opportunity.
How to Play It
Give the above data, when volatility spikes to relative highs, you want to be long volatility. This applies not only to volatility trading but to stock investors: You should be hedged against further volatility spikes.
That’s the general rule. However, as a gap trader, I cannot ignore today’s up gap in the VXX:
Stockcharts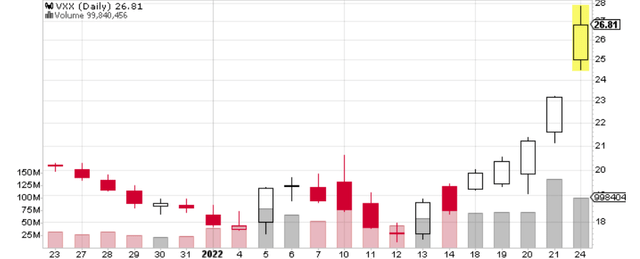
This looks like an area gap – and most up gaps in the VXX are area gaps. Here is the return performance for long positions after up gaps in the VXX:
Damon Verial; data from Tiingo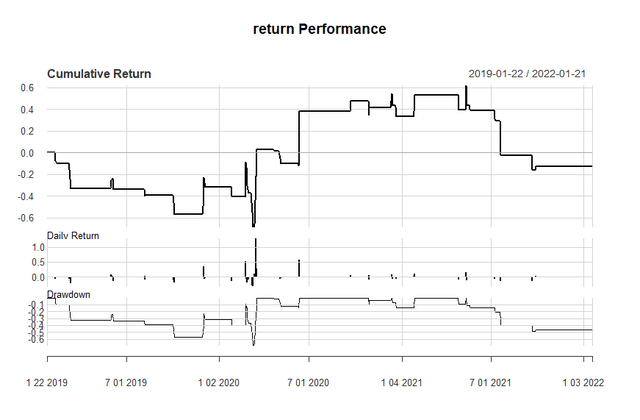
Ultimately, it’s a losing strategy. While some up gaps lead to higher spikes, most do not. However, when you control for the volatility regime, you find that up gaps precede further upward movements in the VXX:
Damon Verial; data from Tiingo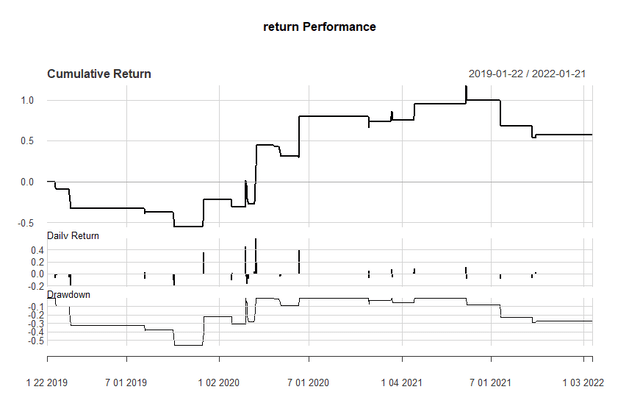
The risk/reward favors the bulls. Thus, the current gap in the chart supports a long position in the VXX – aka hedging volatility. Here is how I would play it on the VXX, whether you are a volatility trader or just want to hedge your long stock positions. Considering large volatility spikes last on average one week, we want to capture that movement while still allowing our call options to retain some time value:
- Buy Feb4 $26 calls
- Roll over weekly
This is a low-risk strategy for traders and a cheap form of insurance for hedgers. Your only risk here is the debt paid for the calls, roughly $400 each contract, at the time of writing (Jan24, 12:00pm). Let me know if you have any questions in the comments section below.
[ad_2]
Source links Google News

