[ad_1]
For holders of the Direxion Daily S&P Oil & Gas Exploration and Production Bull 3x Shares ETF (GUSH), it’s been a turbulent ride. With shares down nearly 80% from the peaks seen in October, investors have had a very hard go of it in recent months. In this article, I will dig into the fundamentals of the exploration and production industry and show you the factors at work which are keeping GUSH from performing strongly. It’s my belief that the industry is hampered by an oversupply situation and the present adverse headwinds seen in the ETF will continue into the near future.
When we deal with an ETF, it always makes sense to dig into its prospectus and figure out exactly what makes it tick. In the case of GUSH, it is an ETF which seeks to give a daily return equal to three times the daily price movements of the S&P Oil & Gas Exploration & Production Select Industry Index. This index follows a methodology which basically tracks a basket of stocks in the oil and gas industry which are in the S&P Total Market Index. This index is broad and includes all eligible common equities which basically means that GUSH ultimately is tracking an investment across the entire exploration and production industry of traded stocks. A glance at the history and holdings reveals two things. First, it shows that the underlying index is broadly spread across 67 stocks which means that returns are not heavily driven by a single stock. And two, it shows that this industry has strongly underperformed the S&P 500 since oil’s peak price in 2014. In this article, I will show you why this has happened and point out that this catalyst of underperformance has not left the market, but in many regards, is perhaps stronger now than it has ever been.
When examining the exploration and production industry, it is important to understand that we are talking about two separate, but not necessarily related commodities: oil and natural gas. For the purposes of this article, we will focus on oil primarily because it is the largest market in the mix. For example, if you look at CME’s leading commodity report, you will see that the financial market for crude oil is almost four times larger than natural gas at over $69 billion in daily traded volume versus natural gas trading at around $19 billion per day. The sheer size of the market and the broad exposure of the index GUSH tracks means that an analysis of the crude oil fundamentals will largely catch the dollar volume of commodity price to which these producers are exposed and therefore the movements of the ETF itself.
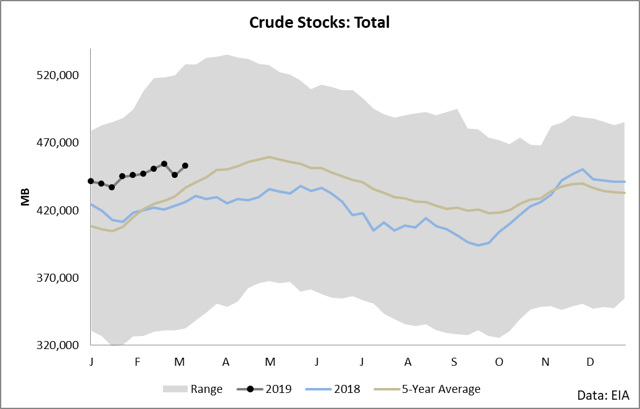
When examining the crude markets, the starting place is always the supply and demand balance as expressed through looking at stock levels versus their 5-year average. As you can see in the following chart, crude inventories in the United States have remained above their 5-year average for the entire year.
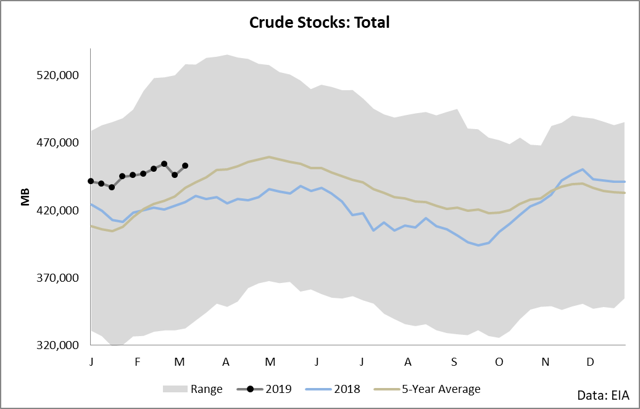
The reason behind this movement is obvious to anyone who has been tracking the exploration and production industry for some time: production has been simply exploding in the United States.
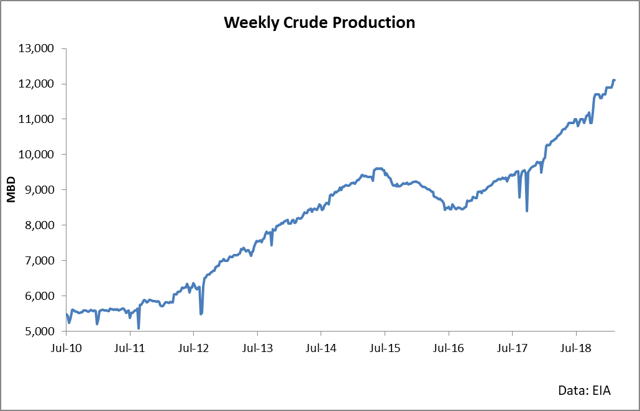
We now produce more crude than Saudi Arabia and our exports continue to climb. This production has been largely driven by drilling activity in a few key plays, the most active of which has been the Permian Bain.
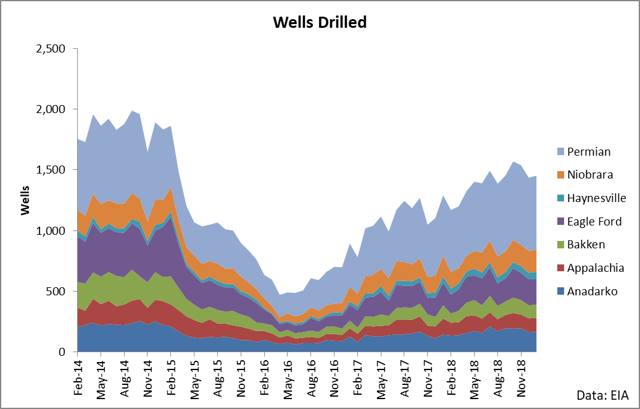
While Permian activity has continued to surge, it is important to note that DUC count (wells drilled but not completed) has massively increased in the Basin.
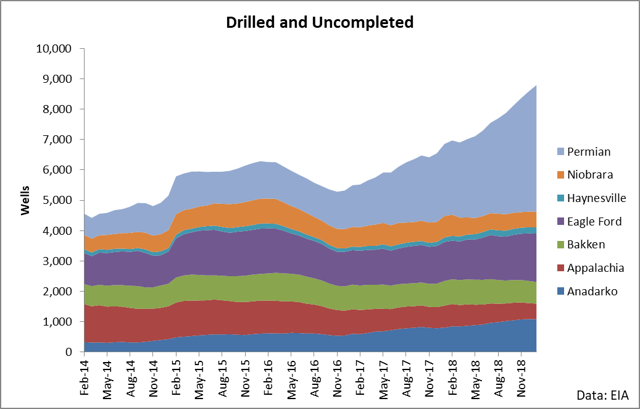
The significance behind DUC wells is this: they signal latent production capacity which is waiting to come online. When adequate logistical constraints are removed, we can expect these 4,170 wells to come online and be converted into additional barrels of supply.
Given all of the drilling activity and crude production across the major regions in which the stocks comprising GUSH are active, you would think these firms were making decisions based on positive economics and therefore increasing earnings which would ultimately drive GUSH higher. However, in actuality, what we are seeing is increasing competition and tightening margins as producers work on lowering their cost of production so as to continue to fuel the steady production growth we are seeing. We don’t have the time or the capability in a single analysis piece to research all 67 companies comprising GUSH, but given the broad-based weighting of the index and its persistent underperformance of the S&P 500 since the peak price of oil in 2014, it is safe to say that this heightened production is a net harm to the profitability of the industry rather than a net benefit.
With the surge in crude production, we have seen the price of crude and the structure of crude hamper the economics of producers. The following chart shows this relationship with great clarity.
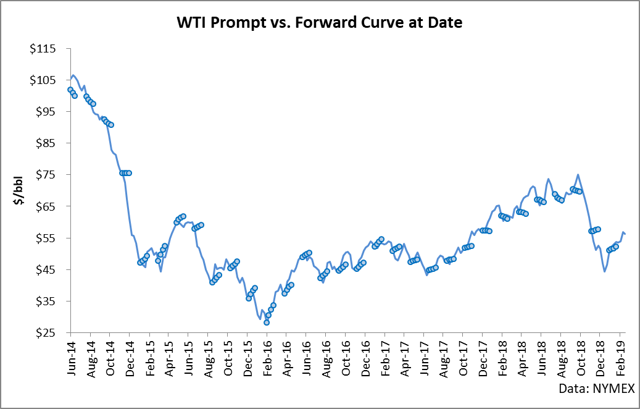
This chart shows two pieces of information. The line chart is the simple price of the front month WTI futures contract on a given date. The dots show the market structure on a given date going forward as expressed through the settlement price of the front four WTI futures contracts on that date.
The power of this chart is contained in understanding both of these two pieces of information at the same time. For example, during the tail-end of 2014, the dots were under the line. This means that during that time period, the market was in a state known as backwardation (front futures trade over back futures) and the financial markets were essentially indicating a state of undersupply. Backwardation is a market state which incentivizes firms to take supply from storage and sell it to the market rather than storing it. When the dots are above the line, it indicates a state of contango on a given date. Contango is when the front contracts trade under the back contracts and is indicative of oversupply. When the market is in contango, it is signaling to producers that a state of oversupply exists and that producers should consider storing crude rather or even delaying producing.
As you can see in the chart above, the market has remained in contango in most every quarter since oil peaked in 2014. Since then, we have seen price hampered and pushed to the downside while the market structure has largely given the message of oversupply. At the most basic of levels, this is exactly why GUSH has underperformed and why we will see it continue to see it underperform into the future.
The fundamental relationship here is this: the market for the primary product which GUSH touches is massively oversupplied. There have been recent dents in this picture from both the domestic supply and demand side, but these dents have not changed the thesis yet. Refining runs (the demand source for crude) remain low due to poor cracking margins. These cracking margins are unfortunately low due to a massive product oversupply of gasoline. Gasoline exports have been rising to try and clear the market, but we remain awash in both crude and product which means that while the producers in GUSH continues to gush forth product, they are doing so into an oversupplied market both for their product and the product their product is converted into.
For holders of GUSH, the case is clear and has remained clear for 5 years: avoid this ETF. The primary market for its production is oversupplied and I expect it to remain oversupplied until refineries begin demanding crude once again. Refineries have currently overproduced, which means that it will take some time before a healthy crude demand resumes. In terms of the crude markets, I expect some life to be seen this summer when driving season kicks off which will likely drive crude prices higher and directly benefit the holders of GUSH. But until then, I would avoid the stock and continue to look for downside action in the ETF.
Disclosure: I/we have no positions in any stocks mentioned, and no plans to initiate any positions within the next 72 hours. I wrote this article myself, and it expresses my own opinions. I am not receiving compensation for it (other than from Seeking Alpha). I have no business relationship with any company whose stock is mentioned in this article.
[ad_2]
Source link Google News

