[ad_1]
wilpunt/E+ via Getty Images
Investment Thesis
The iShares MSCI South Africa ETF (NYSEARCA:EZA) is one of the best instruments to get exposure to the South African economy. The country’s economy grew at an annual mid-single-digit rate in the late 90s and early 2000s and the country become part of BRIC (now BRICS) in 2010, joining Brazil, Russia, India, and China. However, GDP growth slowed down significantly in recent years.
Refinitiv Eikon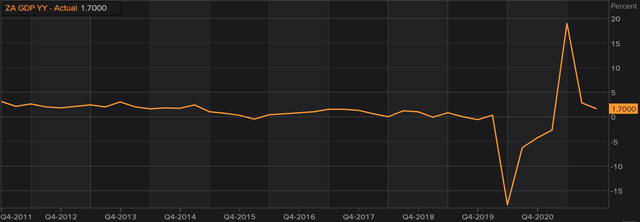
South Africa is now expected to grow at only 2% in 2022, while unemployment is now at the highest level over the last 10 years. According to some estimates, it is projected to reach ~38.6% in 2026.
Refinitiv Eikon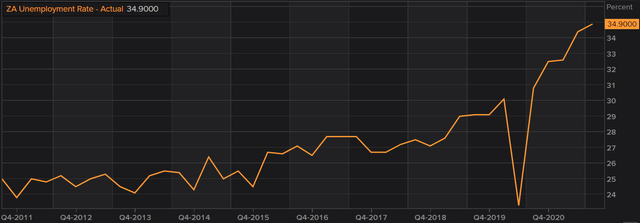
At the same time, the country is not spared from the recent global increase in prices and suffers from high inflation due to rising commodity prices and supply chain disruptions. As a result, the country seems to be on the brink of stagflation, a situation with a low economic growth rate, high unemployment, and elevated inflation. In my opinion, this leads to a situation of high-risk and low reward for investors.
Refinitiv Eikon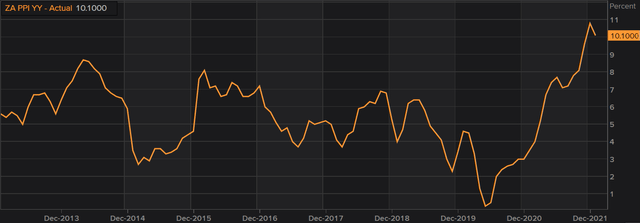
Strategy Details
The iShares MSCI South Africa ETF tracks the investment results of the MSCI South Africa 25/50 Index, composed of large and mid-sized South African equities. The fund can be used to get exposure to the South African economy or to express a view (long/short) about a single country.
If you want to learn more about the strategy, please click here.
Portfolio Composition
From the sector allocation chart below, we can see the fund places a high weight on Financials (representing around 32%), followed by Materials (accounting for 30% of the index) and Consumer Discretionary (representing around 12% of the fund). The largest three sectors have a combined allocation of approximately ~74%. In terms of geographical allocation, EZA invests exclusively in South Africa.
iShares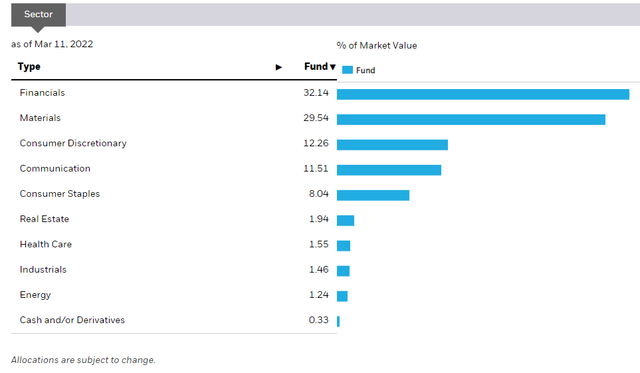
This ETF invests over 30% of the funds into mid-cap blend issuers, characterized as mid-sized companies where neither growth nor value characteristics predominate. Mid-cap issuers are generally defined as companies with a market capitalization between $2 billion and $8 billion. The second-largest allocation is large-cap growth equities, which account for 19% of the fund. It is interesting to see that EZA is mostly invested in mid-cap stocks and ignores small-caps.
Morningstar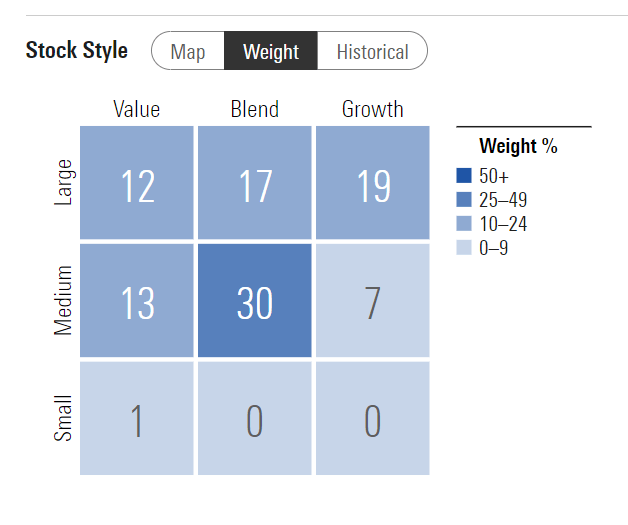
The fund is currently invested in 38 different stocks. The top ten holding account for ~57% of the portfolio with no single stock weighting more than 9%. In my opinion, EZA is concentrated in a few names which are likely to drive future returns. As a matter of fact, the concentration in this ETF is very similar to the one you will find in the NASDAQ 100 where 52% of assets are in the top 10 holdings. I am personally not a big fan of investing in concentrated ETFs since it removes some of the benefits of diversification and increases volatility.
Morningstar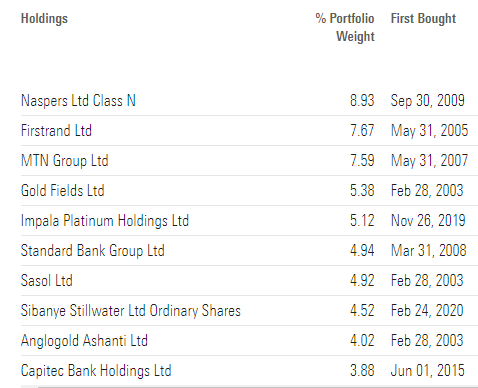
Since we are dealing with equities, one important characteristic is the portfolio’s valuation. According to data from iShares, the fund currently trades at a price-to-book ratio of ~2, and at an average price-to-earnings ratio of ~12. This makes EZA much cheaper than any other US or European ETFs and relatively fairly valued compared to other emerging markets.
Guide to the Markets JPM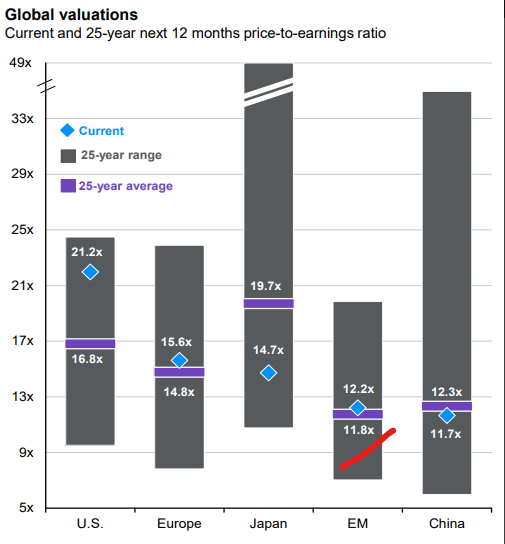
Is This ETF Right for Me?
I have compared below the price performance of EZA against the performance of the iShares MSCI Emerging Markets ETF (NYSEARCA:EEM) over the last 5 years to assess which one was a better investment. Over that period, EEM outperformed EZA. However, it is interesting to see that both strategies delivered similar returns up until Q4 2018 when the performance spread started to widen and EZA really started to underperform other emerging markets. To put EZA’s performance into perspective, a $100 investment 5 years ago in this ETF would now be worth ~$97. This represents a compound annual growth rate of ~-0.6% excluding dividends, which is a terrible absolute return.
Refinitiv Eikon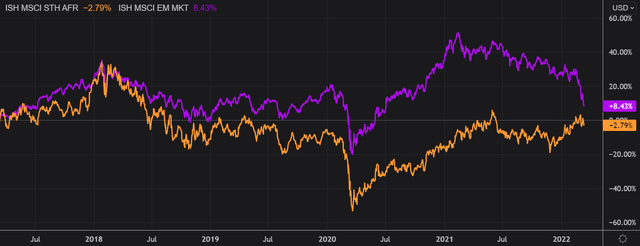
If we take a step back and look at the performance from a 10-year perspective, the results don’t change much. EEM came on top once again, outperforming EZA since mid-2016. I personally believe that EZA can be a good short-term trade, especially if you plan to short it or buy some puts on it. However, I think there is too much uncertainty at this point about South Africa’s future economic outlook to take a long-term bet on EZA.
Refinitiv Eikon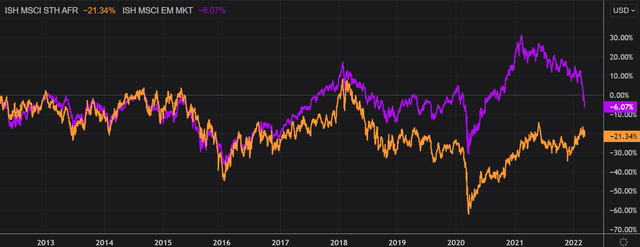
Key Takeaways
EZA provides exposure to a basket of South African mid and large caps. The top ten holding account for ~57% of the portfolio which means EZA is concentrated in a few names which are likely to drive future returns. I believe it is important to see how that fits your diversification goals and if you are comfortable with a concentrated portfolio. In terms of expected returns, the outlook for the South African economy is bleak, at least in the short term. Given the fact that the economy is the main driver of stock returns, buying puts on EZA could be the best trade to benefit from any potential downside, while limiting risk.
[ad_2]
Source links Google News

