[ad_1]
The iShares J.P. Morgan USD Emerging Markets Bond ETF (EMB) is one of the four major USD denominated broad emerging market debt ETFs. The other three funds are the Vanguard Emerging Markets Government Bond Index ETF (VWOB), the VanEck Vectors Emerging Markets Aggregate Bond ETF (EMAG), and the Invesco Emerging Markets Sovereign Debt Portfolio ETF (PCY). Usually when reviewing ETFs, especially index ETFs, there are one or two clear winners and a bunch of also-rans (E.g. all index funds that track the S&P 500 are the same, so pick the one with the lowest expenses and ignore the rest.) In this case, each of these funds is sufficiently different that any one of them could have a place in investors’ portfolios. We will go over EMB, and the others, and how each one is unique.
EMB Overview
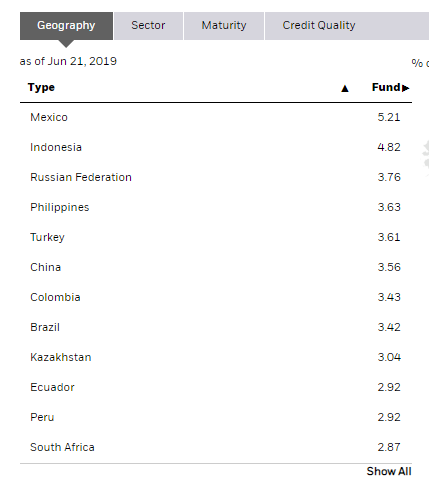
All of the funds invest in dollar-dominated emerging market bonds. After that, the similarities pretty much stop. EMB follows the J.P. Morgan EMBI Global Core Index. The index includes a mechanism for limiting the weight of any one country as well as excluding smaller bond issues. The index also factors in liquidity when selecting bonds for inclusion. The result is a fairly diversified fund. There are approximately 30 major countries in the index and the top holding (Mexico) isn’t much more than it would be under an equal weight scenario (5.21% vs. 3.33%).
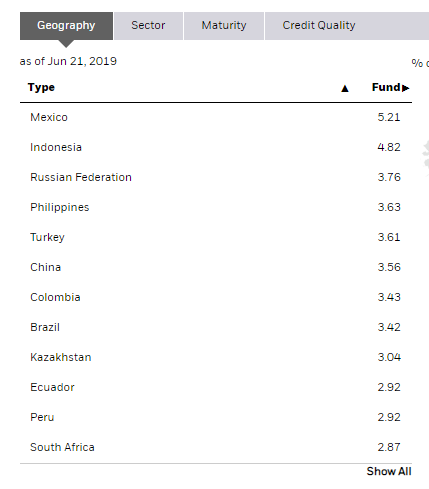
(Source: Fund website)
For this fund, investors pay .39% in expenses annually.
VWOB Overview
The first of three similar competing ETFs is the Vanguard Emerging Markets Government Bond. This fund tracks the Bloomberg Barclays USD Emerging Markets Government RIC Capped Index. The big difference between this fund and EMB is that the cap weighting rules are very generous. VWOB’s exposure to any one bond issuer is limited at 20% and the aggregate exposure of all 5% plus issuers is capped at 48%. The result is you have a bond fund that is much more market-weighted, with larger weighting differences between the top holdings.
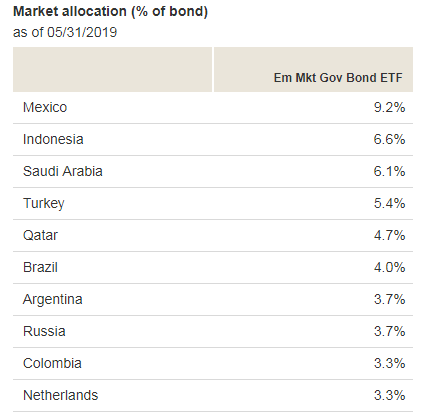
(Source: Fund website)
In what may be a bit of a surprise to readers, the Vanguard fund isn’t significantly cheaper than EMB. Expenses are .30% annually.
EMAG Overview
The second competing fund is the VanEck Emerging Markets Aggregate Bond ETF. This fund tracks the MVIS EM Aggregate Bond Index. The big difference between this index and the indices the previous two funds track is that corporate bonds are now included. Weightings are also capped at 3% per corporate issuer but appear uncapped for sovereign issues. The fund bears some similarities to the Vanguard product when it comes to country weightings, with Mexico taking the top spot and some overlap between several other countries as well (Indonesia, Russia, Brazil, etc.).
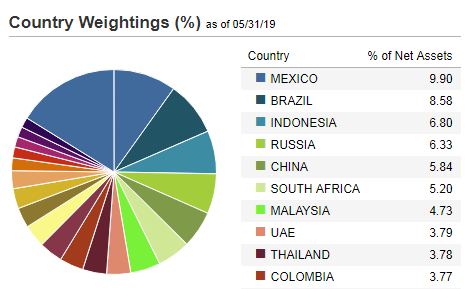
(Source: Fund website)
Again, expenses are similar to the other two funds at .35% annually.
PCY Overview
The third and final fund is the Invesco Emerging Markets Sovereign Debt ETF. This fund tracks the DBIQ Emerging Market USD Liquid Balanced Index. This index is a bit different than the other three because the constituents are “selected using a proprietary methodology”. The index tracks liquid, emerging market, dollar-denominated debt. But beyond that you don’t get much more information on what criteria are used to select securities for the fund. In some ways, the fund is more like an actively managed fund than a passively managed one despite tracking an index.
The result is a fund that is roughly equally-weighted and gives investors higher exposure to economically smaller countries like Peru, Romania, and Kazakhstan.
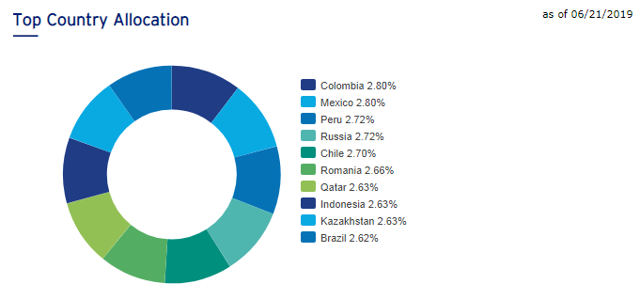
(Source: Fund website)
Because the fund resembles an actively managed fund more than a passive fund it’s not a surprise expenses are higher at .50% annually.
Comparison
The table below sums up some of what we’ve already talked about along with some additional pertinent information about each fund.
|
Ticker |
Corporates (Y/N)? |
% “Junk”* |
Eff. Duration |
Expense Ratio |
|
EMB |
No |
46.94% |
7.58 |
.39% |
|
VWOB |
No |
43.50% |
7.2 |
.30% |
|
EMAG |
Yes |
36.65% |
5.55 |
.35% |
|
PCY |
No |
56.00% |
9.35 |
.50% |
*Includes unrated bonds
(Source: Fund website)
In addition to what we discussed, we can see other significant differences between the funds. There’s a big difference in the proportion of the fund that carries an investment grade rating. PCY has a majority of fund assets in junk or unrated securities while almost two-thirds of EMAG is in investment grade securities. Likewise, effective duration differs among the funds. PCY has the longest effective duration while EMAG is the shortest.
What’s surprising is that despite all the differences, performance has not varied widely save for EMAG.
|
Ann. Avg. NAV returns (5/31/2019) |
1YR |
3YR |
5YR |
10YR |
|
EMB |
6.96% |
4.69% |
3.92% |
5.89% |
|
VWOB |
7.23% |
4.97% |
4.09% |
n/a |
|
EMAG |
4.24% |
4.12% |
1.36% |
n/a |
|
PCY |
8.36% |
4.38% |
4.1% |
7.26% |
(Source: Fund website)
Summary
Given the differences between the funds, it’s hard to say one is definitively the best emerging market USD bond fund. What fund is best depends on the investor’s preferences. If you are someone comfortable with higher risk then a longer duration fund with a greater percentage in below investment grade credit like PCY might be the best choice. If you don’t mind country concentration and just want the lowest expenses, VWOB fits the bill. For an investor that wants lower risk (in the context of emerging market debt funds), EMB could make a good pick. It’s one of the most diversified by country weighting. It does not contain any corporate bonds (higher credit risk than sovereign bonds) and has a decent percentage of bonds rated as investment grade. Duration is also in the middle of the pack.
Disclosure: I/we have no positions in any stocks mentioned, and no plans to initiate any positions within the next 72 hours. I wrote this article myself, and it expresses my own opinions. I am not receiving compensation for it (other than from Seeking Alpha). I have no business relationship with any company whose stock is mentioned in this article.
[ad_2]
Source link Google News

