[ad_1]
kool99/iStock via Getty Images
Investment thesis
Consumer staples perform well in sideways markets. Year-to-date, the Consumer Staples Select Sector SPDR ETF (NYSEARCA:XLP) has performed better than the broad market.
The ETF includes many large companies that produce essential goods for the consumer, such as household products, food products, beverages, tobacco and personal products. These companies continue to perform relatively well during economic slowdown including periods of heightened inflation.
The economic news support strong consumer spending. Here is an extract from an article on yahoo.com:
Retail sales increased 0.5% after registering a revised 0.8% jump from January to February… Spending has been fueled by wage gains, solid hiring and more money in banking accounts. January’s increase of 4.9% was the biggest jump in spending since March 2021.
Top 10 Holdings (70.05% of Total Assets)
|
Name |
Symbol |
% Assets |
|
Procter & Gamble Co |
PG |
15.54% |
|
Coca-Cola Co |
KO |
9.88% |
|
PepsiCo Inc |
PEP |
9.63% |
|
Walmart Inc |
WMT |
9.11% |
|
Costco Wholesale Corp |
COST |
4.70% |
|
Philip Morris International Inc |
PM |
4.55% |
|
Mondelez International Inc Class A |
MDLZ |
4.44% |
|
Altria Group Inc |
MO |
4.35% |
|
The Estee Lauder Companies Inc Class A |
EL |
4.06% |
|
Colgate-Palmolive Co |
CL |
3.79% |
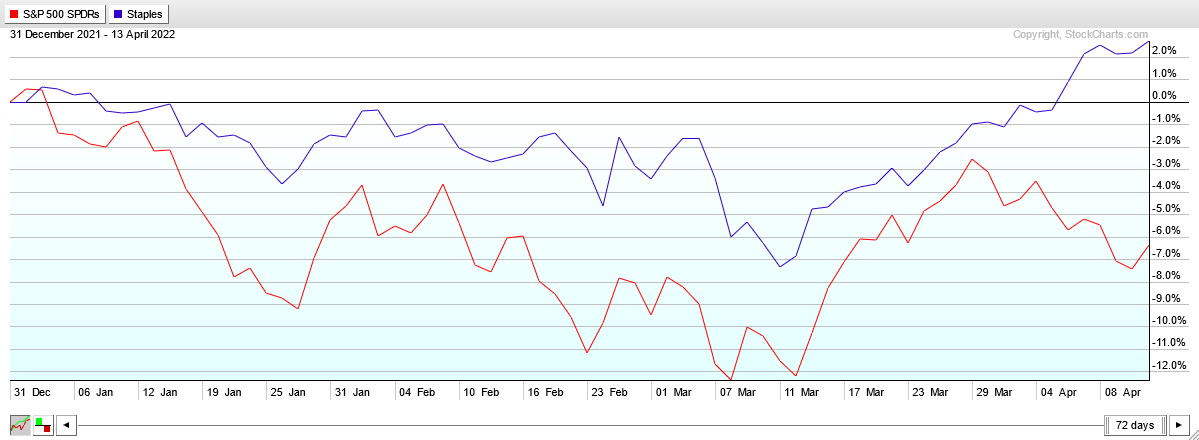
The graph below shows, side by side, the YTD price of XLP and SPY. We see that until March 14 XLP declined less than SPY. Since then, while SPY suffered a week of sell-off, XLP continued its uptrend.
XLP and SPY PERF charts (stockcharts.com)
Application: XLP as “safe asset”
I consider using XLP as a “safe asset” for some portfolios of the AMI marketplace service.
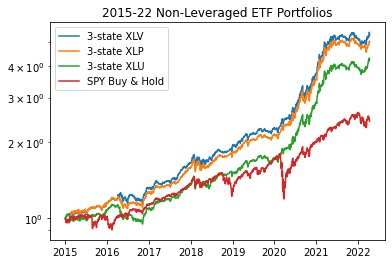
As a first example, I simulated the non-leveraged ETF portfolio for the period January 2015 to April 2022. The portfolio is manages using a 3-state risk indicator as described in this article.
Here is a concise review of the rules of the 3-state managed portfolios.
- Risk-on – 100% equities
- Risk-neutral – 50% equities + 50% safe assets (Treasury Bonds)
- Risk-off – 100% safe assets (Treasury Bonds)
In these simulations I investigate the use of a different set of “defensive assets” during risk-neutral state. Here is the list of assets that were considered: IEF, BND, GLD, XLU, XLP and XLV.
Based on the results of these simulations, the risk-neutral state will invest 100% in defensive assets. The following tables and graph show the performance obtained with XLU, XLP and XLV as defensive assets.
|
2015-22 NONLEV |
CAGR |
stdev |
maxDD |
Sharpe R |
Sortino R |
|
XLU |
22.19% |
13.92% |
-16.57% |
1.59 |
2.02 |
|
XLP |
24.85% |
13.48% |
-12.04% |
1.84 |
2.38 |
|
XLV |
26.23% |
13.68% |
-11.18% |
1.92 |
2.52 |
Author
The next table shows the annual returns.
|
YEAR |
XLU |
XLP |
XLV |
|
2015 |
7.49% |
14.39% |
14.16% |
|
2016 |
0.54% |
9.49% |
14.31% |
|
2017 |
24.46% |
25.74% |
25.98% |
|
2018 |
10.76% |
14.34% |
16.30% |
|
2019 |
15.50% |
18.27% |
17.98% |
|
2020 |
65.10% |
65.28% |
63.90% |
|
2021 |
36.97% |
36.97% |
36.97% |
|
2022 |
-3.67% |
-2.56% |
-3.58% |
Current State
The risk-indicator is currently in the risk-neutral state since the beginning of March. Therefore, the non-leveraged portfolio invests in a combination of the following assets: XLP, XLU, XLV.
Conclusion
Our XLP recommendation is a “Buy”.
[ad_2]
Source links Google News

