[ad_1]

titoOnz/iStock via Getty Images
Investment Thesis
With some of the fastest-growing economies in the world, African nations are playing an increasingly significant role in the global economy. The population is young and rapidly growing, and household incomes and consumption are projected to rise. According to the WEF, more than 40% of Africans would be in the middle or upper classes by 2030, leading to increased demand for products and services. As a result, household spending is predicted to reach $2.5 trillion in 2030, more than double the 2015 figure ($1.1 trillion). The continent is also home to an abundance of natural resources. For instance, it has huge, untapped reserves of natural gas and oil and largely unexploited hydroelectric power. In this article, I will review the VanEck Vectors Africa Index ETF (NYSEARCA:AFK), which provides exposure to publicly-listed companies doing business in Africa.
Strategy Details
The VanEck Vectors Africa Index ETF tracks the performance of the MVIS GDP Africa Index. “The index includes local listings of companies that are incorporated in Africa and listings of companies incorporated outside of Africa but that have at least 50% of their revenues coming from Africa.”
If you want to learn more about the strategy, please click here.
Portfolio Composition
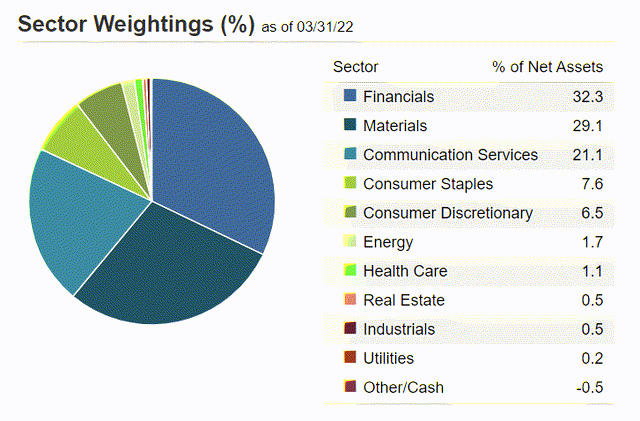
The index places a high weight on the Financial sector (representing around 32% of the index), followed by Materials (accounting for 29%) and Communication Services (representing around 21% of the fund). The largest three sectors have a combined allocation of approximately 82%.
VanEck ETFs
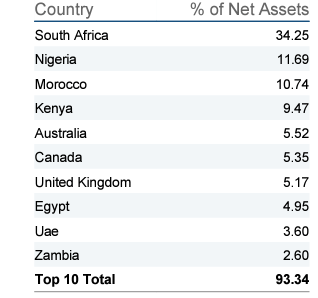
In terms of geographical allocation, nearly ~34% of the fund is invested in South Africa, followed by Nigeria (~11.7%) and Morocco (~10.7%). It is interesting to see that AFK doesn’t rank countries by GDP, but rather by how well the capital markets are developed in those countries. Egypt, for instance, which is the second-largest African economy by nominal GDP comes only 8th on the list, with 5% of total assets.
VanEck ETFs
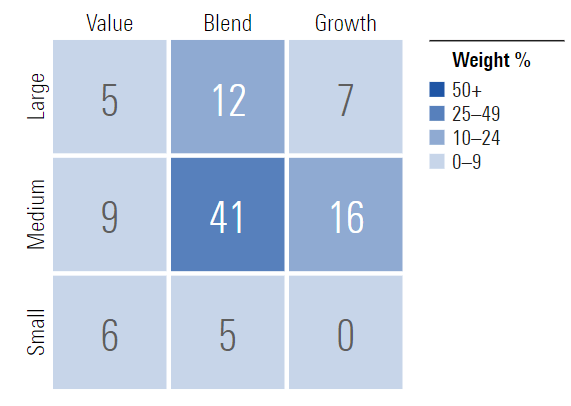
~41% of the portfolio is invested in mid-cap blend issuers, characterized as mid-sized companies where neither growth nor value characteristics predominate. Mid-cap issuers are generally defined as companies with a market capitalization between $2 billion and $8 billion. The second-largest allocation is mid-cap growth equities. It is interesting to see that AFK allocates approximately 77% of total assets to small and mid-cap issuers, which generally have a larger runway to grow than large-cap issuers and can therefore provide higher returns over the long term. That said, small and mid-cap stocks generally have higher betas, thus I think it is important to see if you are comfortable with a higher level of volatility before purchasing AFK.
Morningstar
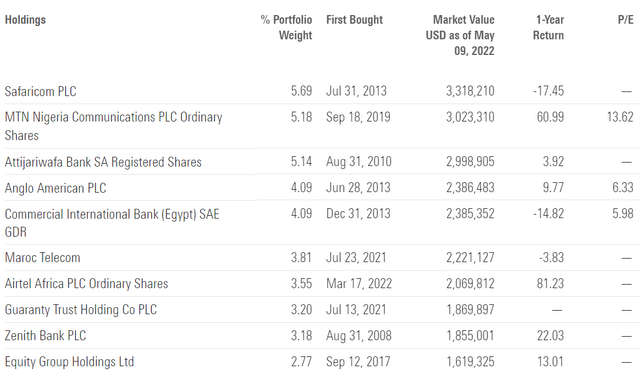
The fund is currently invested in ~79 different stocks. The top ten holding account for ~42%, with no single stock weighting more than 6%. All in all, AFK is well-diversified and has a very low level of unsystematic risk as a result. However, I think it is important to highlight the fact that AFK doesn’t diversify the emerging market risk. In other words, all countries included in this basket are emerging economies and by owning AFK, you are facing some undiversifiable risks specific to emerging markets.
Morningstar
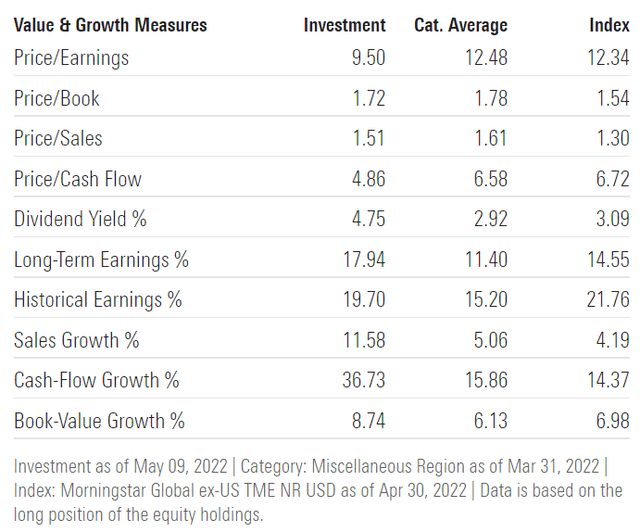
Since we are dealing with equities, one important characteristic is the portfolio’s valuation. According to data from Morningstar, AFK currently trades at a price-to-book ratio of ~1.7 and a price-to-earnings ratio of 9.5. This is extremely cheap if you compare it to developed markets which generally trade at over 14x earnings.
Morningstar
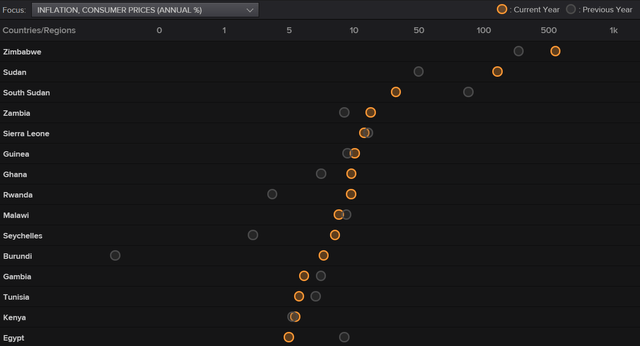
However, this countries come with a unique set of challenges. For instance, if you look at the countries with the highest inflation rate in the world, African countries are overweighted in that list. The same goes for other crucial metrics such as unemployment. In my opinion, AFK’s valuation fairly reflects the fundamentals of the underlying economies and deserves a discount relative to developed markets and other emerging markets that are in a better shape.
Refinitiv Eikon
Is The ETF Right for Me?
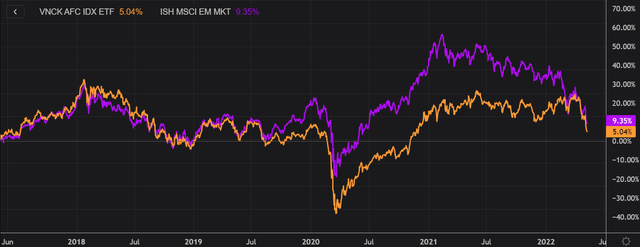
I have compared AFK’s total returns against the iShares MSCI Emerging Markets ETF (EEM) over the last 5 years to assess which one was a better investment. Over that period, both funds had similar results, with EEM slightly outperforming AFK.
To put AKF’s results into perspective, a $100 investment 5 years ago in this ETF would now be worth ~$105.04. This represents a compound annual growth rate of ~0.99%, including dividends, which is a mediocre absolute return in my opinion.
Refinitiv Eikon
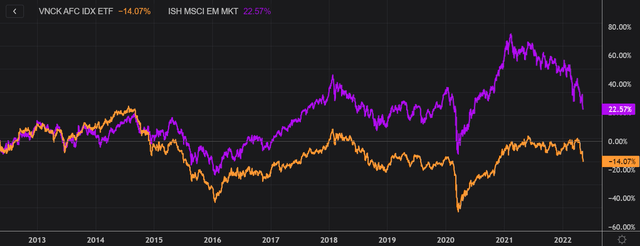
If we take a step back and look at the 10-year total return, the results don’t change much. EEM came on top once again, outperforming AFK since early 2015. I think it is worth noting fact that AFK failed to deliver positive returns over 10 years despite a good dividend yield and low valuations. I think this is a good example where low valuations are not enough to make a fund/stock a great investment and that you need additional factors that will contribute to its success.
Lastly, with a rising dollar and the potential for a global recession increasing, I would personally avoid investing in emerging markets at the moment, since I believe better opportunities will be available in Europe and North America over the next months.
Refinitiv Eikon
Key Takeaways
AFK provides exposure to publicly-listed companies doing business in Africa. For many investors, Africa’s young and rapidly growing economy represents a lucrative market. AFK is trading at less than 10x earnings, which is fairly valued in my opinion given the specific risks associated with emerging markets. As the probability of a global recession is now higher than a few months ago, I would personally be patient and wait for better opportunities in Europe and North America.
[ad_2]
Source links Google News

