[ad_1]
imaginima
Is the FANGMAN dead? Most have written off all versions of acronyms that describe mega-cap tech/media/telecom (TMT) stocks that led the S&P 500 higher from the early 2010s through about a year ago.
A once-popular, now infamous, way to play the space is not through the Information Technology sector, but via the Communication Services Select Sector SPDR Fund (NYSEARCA:XLC).
The ETF features a very low 0.10% annual expense ratio with a tiny 0.02% median bid/ask spread and has nearly $9 billion in assets under management, making it one of the biggest sector funds traded. Investors use XLC to get exposure to companies from the following industries: Diversified telecommunication services; wireless telecommunication services; media; entertainment; and interactive media and services.
On valuation, XLC has strong trailing 3-5-year earnings growth of 11.5%, according to SSGA. With just 25 total holdings, and much of that historical growth induced by pandemic-related stimulus, there’s high uncertainty about what future growth will be. XLC has a forward P/E ratio of 14.7, according to the fund’s website. You won’t capture much income as the 30-day SEC yield is just a smidge above 1%.
What’s interesting about the Communication Services sector, though, is that it contains some companies popular with dividend investors. AT&T (T), Verizon (VZ), and Comcast (CMCSA) are just a few of them. Those high-yield blue chip stocks look less attractive now that safe yields in Treasury securities are near 4%. Investors are better off owning high-yield stocks on their own and owning high-growth names separately. Housing them all in this one fund mixes investing objectives, in my opinion.
Comm Services Stocks’ Dividend Yields
Finviz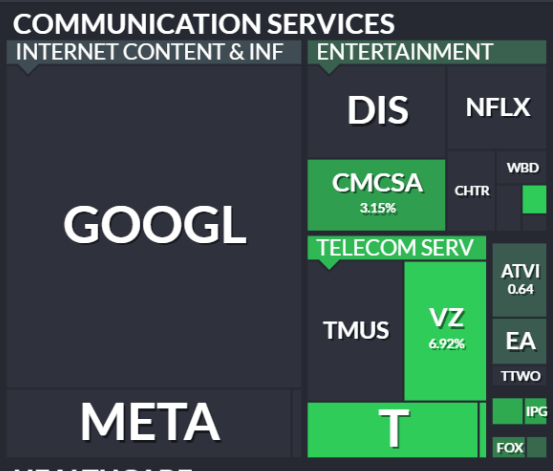
Of course, growth-focused names like Alphabet (GOOG) (GOOGL), Meta Platforms (META), and Netflix (NFLX) comprise a whopping 44.4% of XLC as of Nov. 15.
SSGA: XLC Highly-Weighted to Tech-Related Stocks
SSGA Funds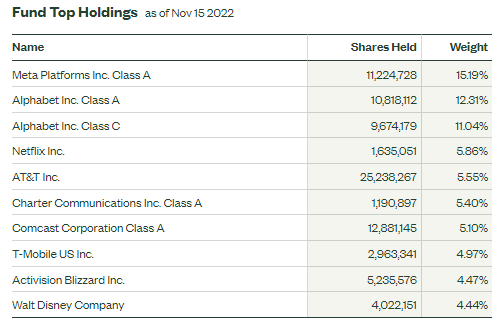
Morningstar: XLC Top Holdings With Reasonable Valuations
Morningstar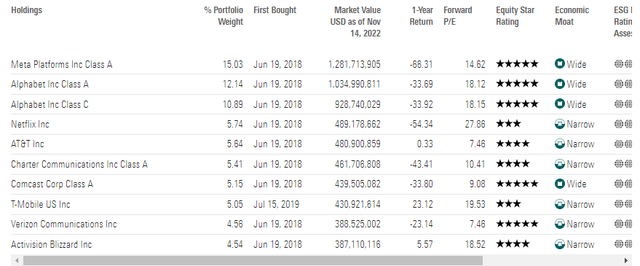
Last week, another one of the sector’s big components, Disney (DIS), missed on profit and revenue estimates in its Q3 report. The management team also warned of declining future growth in its key streaming segment. Making matters worse, the firm’s parks and media divisions fell short of what analysts were looking for, too. The stock gapped lower, then finished the trading day post-reporting for its worst session in 21 years.
On the plus side, shares in Alphabet, Meta, and Netflix have all rallied off their respective Q4 lows, but those gains are not as impressive compared to the overall market’s 11.4% gain in the last four weeks. XLC really needs rates to drop, but even in this recent pullback in the U.S. 10-year yield, XLC has not done all that well compared to the S&P 500.
In fact, Bank of America Global Research’s lead technical analyst Steven Suttmeier concludes that the Communication Services sector remains weak overall within a big lagging trend. The group is below major support at the 2004-2012 relative big base breakout point. Bottoming signs are elusive, says Suttmeier.
BofA: XLC Below Support, No Signs of a Bullish Turn in Relative Strength
BofA Global Research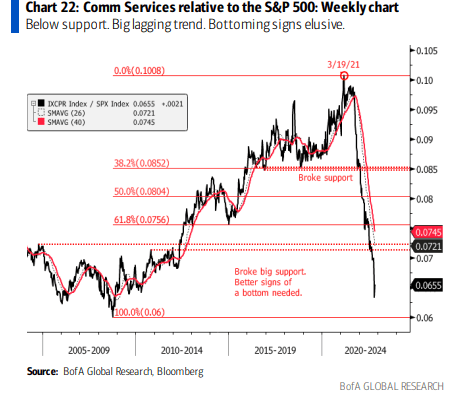
Fundamentally, analysts at Goldman Sachs see declining per-share profit growth for the sector. The major investment bank forecasts a whopping 17% top-down adjusted EPS drop this year and a goose egg in 2023, underperforming the broad market (ex-energy) expected per-share profit growth.
Goldman Sachs S&P 500 EPS Forecast
Goldman Sachs Investment Research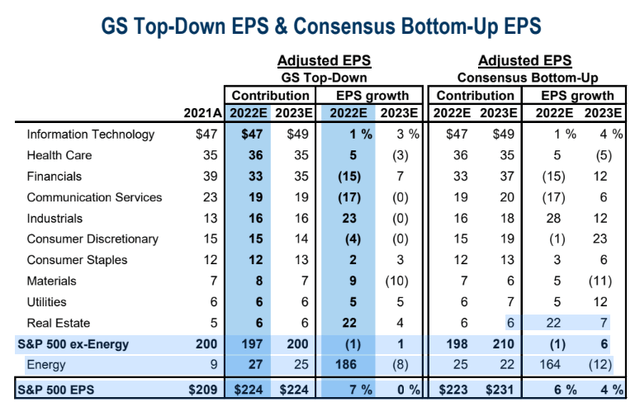
The Technical Take
XLC has an interesting chart right now. There are some factors in the bulls’ court while the bears can clearly point to a broad downtrend since September 2021.
On the plus side, I see bullish divergence on the RSI indicator at the top of the chart as well as a high number of shares traded in the $46 to $50 range. The stock barely undercut that support at its November low, but the fund has since rallied more than 10% to above that range.
Bears have lots of ammo with XLC. For starters, there’s what looks like an increasing likelihood of a test of the key $38 to $39 range – the lows from late 2019 and in March 2020. Also, there could be resistance around $58 – the pre-COVID high and about where the falling 200-day moving average comes into play. $52 to $53 could also be problematic in the near term – the June low, October high, and where a downtrend resistance line appears.
XLC: Bullish Divergence Within A Broad Downtrend. Burden of Proof on the Bulls
Stockcharts.com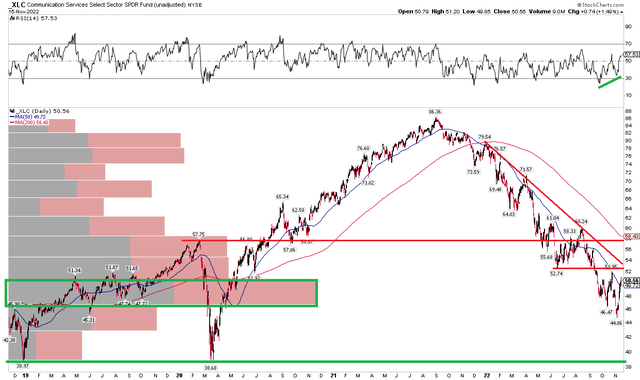
The Bottom Line
While the valuation of XLC looks much better today, near the market’s multiple, big relative weakness and a broad downtrend on the chart are just too much to overcome.
[ad_2]
Source links Google News

