[ad_1]

Amey Bane/iStock Editorial via Getty Images
Large in size with a large English speaking population, the Indian economy is on the cusp of being unleashed, if the government follows through on its economic agenda. In this article I make the case for investing in Indian equities and reviewing investing options available to US investors.
Global vs. Indian Growth
Global economic growth is slowing sharply, as 40 year high inflation grips most large economies. This has resulted in Central Banks across the world raising interest rates by large increments, quickly, which is likely to lead to recession. Higher interest rates will impact investment opportunities, consumption, and thus trade between nations. India is among the few major economies that will grow above Global Growth in 2022 and 2023. The Indian government and the World Bank estimate growth to be around 7% in 2022 and around 6% in 2023. India recently surpassed the UK to become the fifth largest economy in the world, as measured by GDP. If India is able to have a stable government, inflation under control, and economic conditions for growth, then it is expected to become the third largest economy in the world by 2030. Current rapid growth in the Indian economy is driven by modernization of infrastructure and the Make In India campaign, as the government pushes to create manufacturing capacity for local consumption and exports.
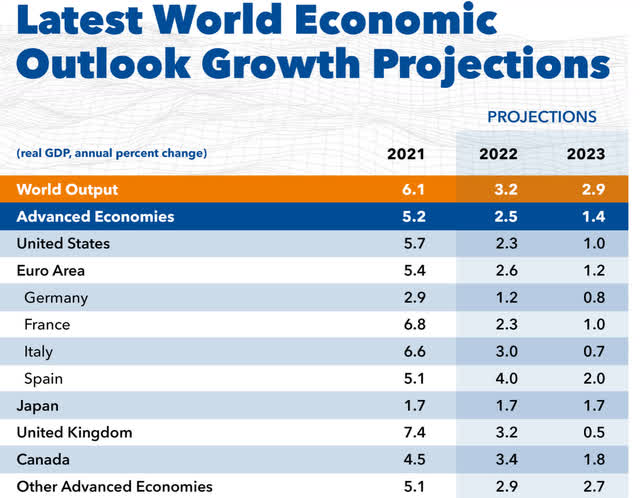
World Economic Growth Projections (‘IMF’)
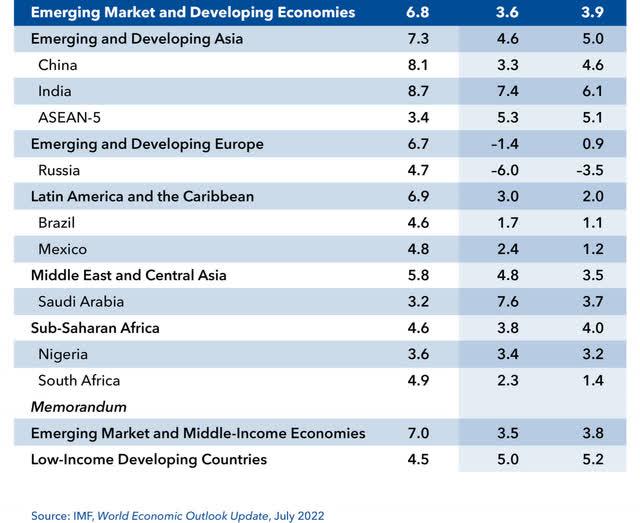
World Economic Growth Projections (‘IMF’)
Risks
Before I lay out the investment options, it is critical to educate oneself of the risks to US investors. Continuing inflation is a major risk in meeting growth targets for almost all countries across the world including India. Higher inflation and higher interest rates will suppress growth. Developing countries like India are far more susceptible to inflation due to inefficiencies in the economy and the importation of energy. Corruption and bureaucracy have plagued India. However, there seems to be progress to effectively deal with both, so they do not impact the current growth. Currency risks for US investors is another concern. In the past 30 years, the Indian Rupee has lost more than half its value to the US Dollar. A depreciating currency will be a headwind for US investor returns. However, in the recent past year, the Indian Rupee has held up much better than most currencies to the US Dollar.
US investors’ option to invest in India
There are a lot of choices if one wants to invest in Indian companies. There are 12 ETFs, 1 leveraged ETF, a couple of closed end funds, and 6 or more mutual funds that have an Indian focus. The choices above do not include emerging markets ETFs and mutual funds that also have allocation to companies based in India. One can also buy from among the stocks of Indian companies that trade on the US exchanges. I’m choosing to explore 4 ETFs that closely replicate Nifty 50 over other options for this article.
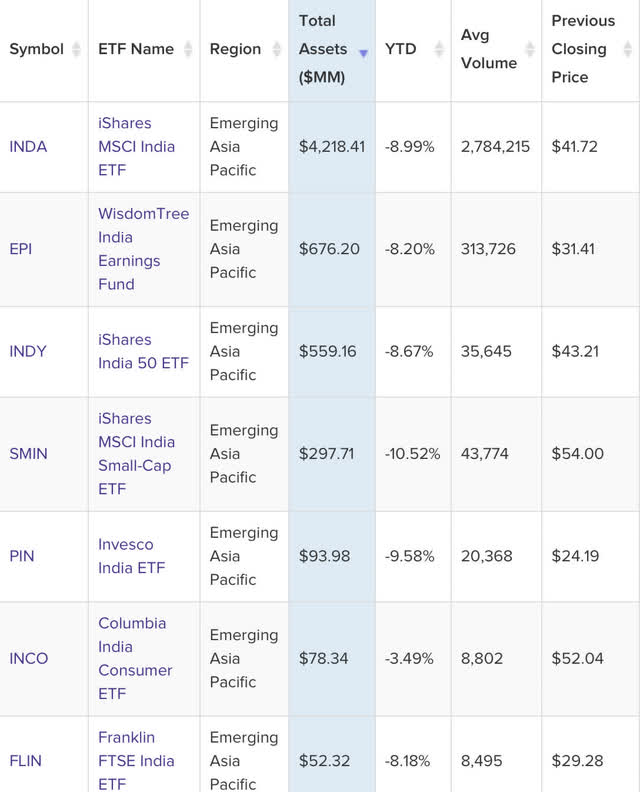
ETF India Focus (ETF Database )
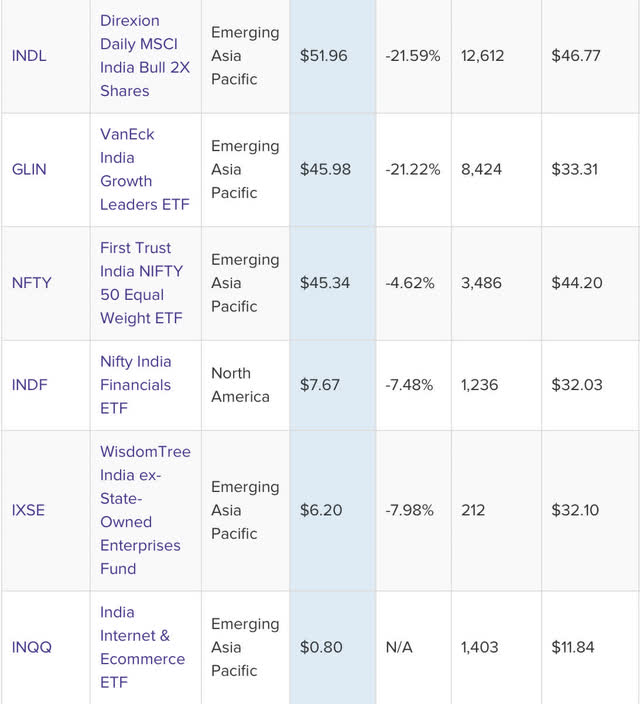
ETF India Focus (ETF Database )
Performance of Nifty 50
The Nifty 50 chart is one of the better charts from a technical analysis perspective. The chart is above the weekly Ichimoku Cloud and is holding up well considering the big drops in stock markets around the world. Not only is the Nifty 50 holding up, but it is creating a big base from which it could breakout to the upside if it closes and stays above 18000.
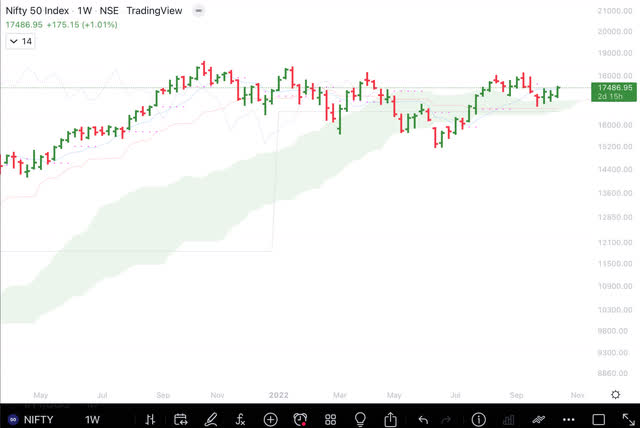
Nifty 50 chart (Author)
The Nifty 50 is outperforming the SPY and most markets around the world. While the Nifty 50 is barely down in 2022, the SPY is down more than 20%.
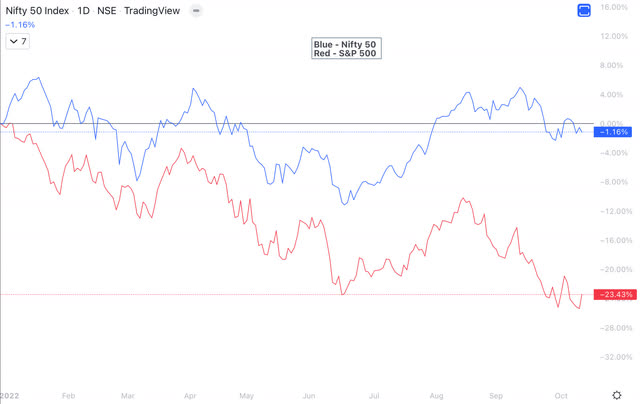
2022 Nifty SPX (Author)
The Nifty has gained twice as much as the S&P 500 since the COVID lows.
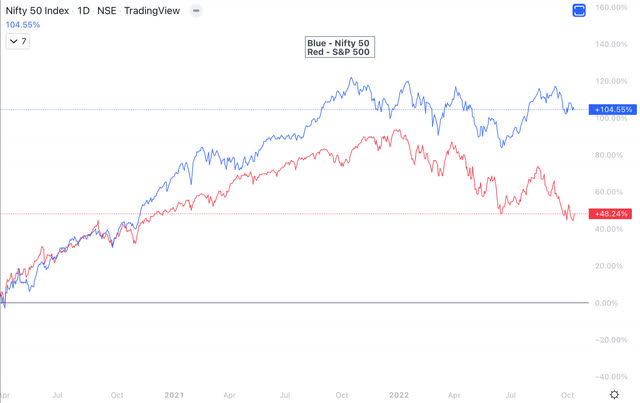
Nifty SPX (Author)
Valuation
The Nifty 50 is around the median in terms of Trailing Twelve Months Price to Earnings and Price to Book ratio going back over 20 years. Dividend yield is at the lower end of the range over the past two decades. While it is not exactly a bargain, the valuations to growth potential is attractive for long term investors.
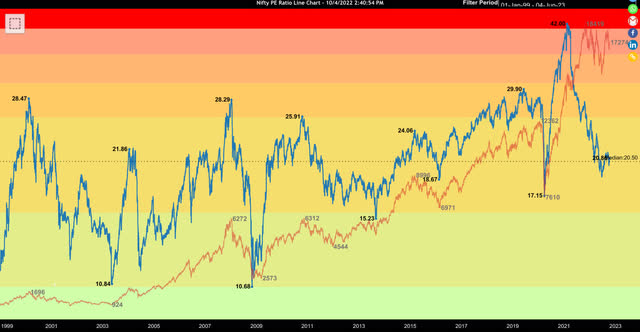
NIFTY PE (Zerodha )
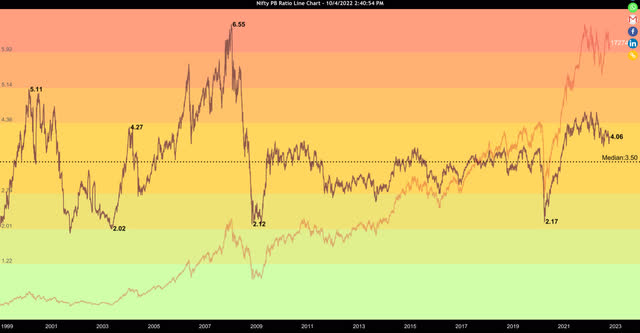
Nifty PB (Zerodha)
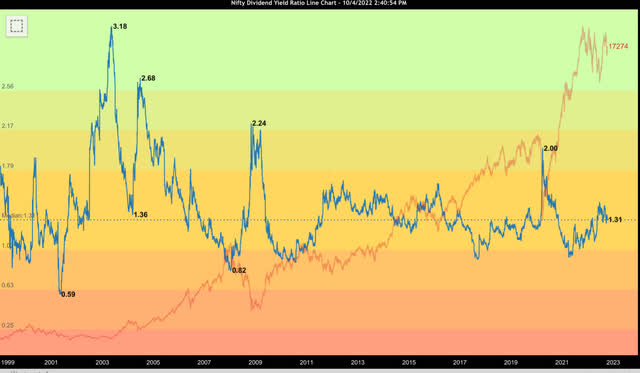
Nifty Yield (Zerodha )
Investment choices
There are a number of choices that invest in large-cap well known Indian companies. The ETFs that we are comparing in this article are iShares MSCI India ETF (INDA), iShares S&P India Nifty Fifty Index ETF (INDY), WisdomTree India Earnings ETF (NYSEARCA:EPI), and the First Trust India NIFTY 50 Equal Weight ETF (NFTY). The reason to consider these 4 ETFs is primarily to pick from amongst the ETFs that closely replicate Nifty 50.
Performance, Dividend yield and Expenses
Annual fee, number of holdings, and yield are as follows:
INDY has 51 holdings, with an average PE of 21.74, an annual fee is 0.89% and yield of 7.93% over the past 12 months
INDA has 109 holdings, with an average PE ratio of 22.93%, an annual fee is 0.65% and yield of 7.09% over the past 12 months
EPI has 440 holdings, with an average PE of 9.78%, an annual fee is 0.84% and yield is 2.91% over the past 12 months
NFTY has around 50 equal weighted holdings, with an average PE of 17%, an annual fee is 0.80% and yield is 1.71% over the past 12 months
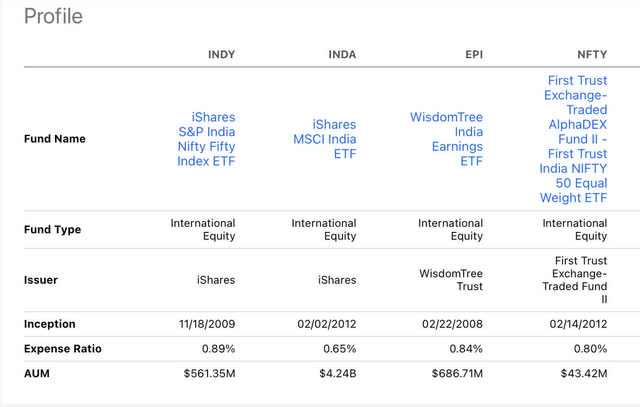
Profile (Seeking Alpha Premium)
Grading ETFs
Seeking Alpha has assigned them higher risk grade and higher expense (annual fee), as their expenses are almost twice median ETF expenses. However, all of them have a B or better grade for Momentum due to the outperformance of Indian stocks.
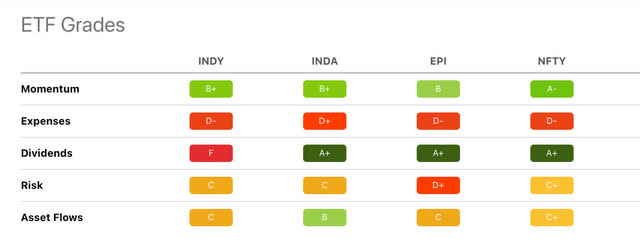
ETF Grades (Seeking Alpha Premium )
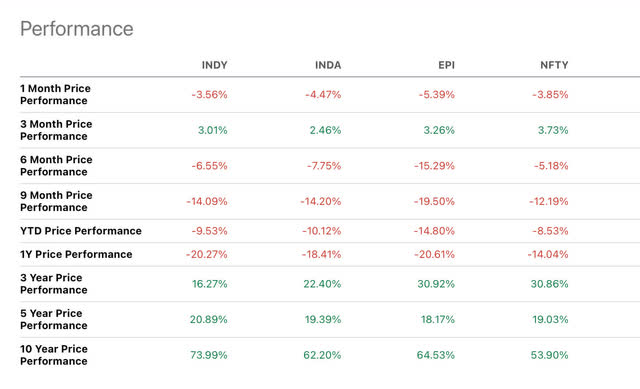
The performances over 3 years, 5 years, and 10 year are close to each other, however, the EPI has been more consistent than the other ETFs. The outperformance is likely because the EPI has 440 holdings while the other ETFs have 100 or fewer holdings. Dividends for past 12 months were higher for INDY and INDA.
Performance comparison (Seeking Alpha Premium )
Liquidity
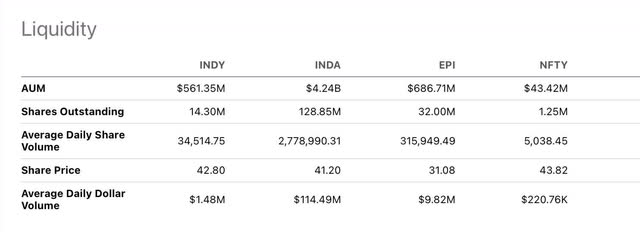
Out of the 4 ETFs, the Nifty has a low daily trading volume. If one is considering picking an ETF, I would recommend going with an ETF that has ample liquidity.
Liquidity (Seeking Alpha Premium )
Underperformance
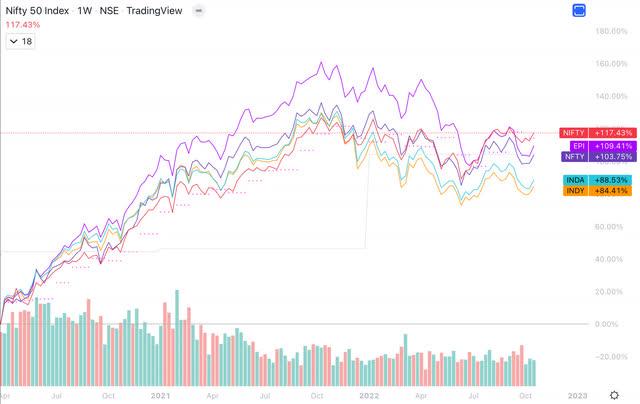
Any of the India-focused ETFs can underperform due to performance of the holdings, currency depreciation, liquidity, and other factors. In the past, the India focused ETFs have had underperformance to the Nifty 50 by 10-25%.
As noticed in the chart below, the ETFs are lagging behind the performance of the Nifty since COVID.
Comparison to Nifty (Author )
Sector Weighting
Sector Weighting is as follows:
EPI INDA INDY NFTY
Materials 23.74% 9.01% 6.54% 13.84%
Financials 16.84% 25.04% 37.23% 21.83%
Energy 16.82% 12.28% 12.60% 9.79%
Information Technology 12.52% 15.13% 14.13% 9.85%
Utilities 7.10% 6.43% 1.96% 3.77%
Consumer Discretionary 5.64% 8.76% 7.04% 13.90%
Industrials 5.58% 5.60% 4.81% 3.90%
Consumer Staples 4.22% 9.29% 9.03% 9.97%
Health Care 4.10% 4.85% 3.96% 10.18%
Communication Services 3.01% 2.95% 2.50% 2.08%
Other 0.43% 0.52% 0.19% 0.00%
EPI uses smart beta where weight is assigned based on profitability, relative price to earnings, across market cap. INDY has a heavy weighting in the financial sector. NFTY lacks liquidity and thus not the better option. INDA and INDY have lagged Nifty 50 index and so I do not recommend either INDA or INDY as investment options at this time. Based on its performance, dividend yield, and annual fee, my recommendation would be to choose the EPI ETF.
Recommendation
Firstly, one has to understand the risks of investing in a developing country. If one is comfortable, then India focused ETFs represent growth in a challenging economic environment. This is due to improving economic fundamentals and the charts which show the Nifty 50 to be a good risk to reward opportunity for investment. For multiple reasons the EPI ETF is the better option to capture economic growth of India for the coming decade.
[ad_2]
Source links Google News

