[ad_1]
Nastassia Samal
Article Purpose
Did you know there are nearly 70 U.S. value ETFs trading today? Chances are, the one you own isn’t the optimal choice, but you made a solid educational guess by researching the ETF’s strategy, past performance, fees, and the provider itself. After all, the time it takes to explore them all is unreasonable for most investors. While I can’t condense all my research into a single article, I believe I can add color to the space by providing relevant data on each ETF’s fundamentals and historical returns in an easy-to-digest format.
This article has three sections categorized by size focus: large-cap, small- and mid-cap, and all-cap. Within each section, you’ll find two tables. The first contains general information on the ETF’s strategy, weighting scheme, inception date, fees, and AUM. The second provides historical returns and fundamentals covering volatility, growth, valuation, and profitability. I hope you can use this information to find the best value ETF for your circumstances, so without wasting any time, let’s get started with the large caps.
Large-Cap Value ETFs
This most popular category has 26 ETFs with a combined $220 billion assets under management. The average expense ratio is 0.33%, though the longest and most established ones, like VTV and SPYV, charge just 0.04%. If you’re a value investor, you likely own at least one in the list below.
The Sunday Investor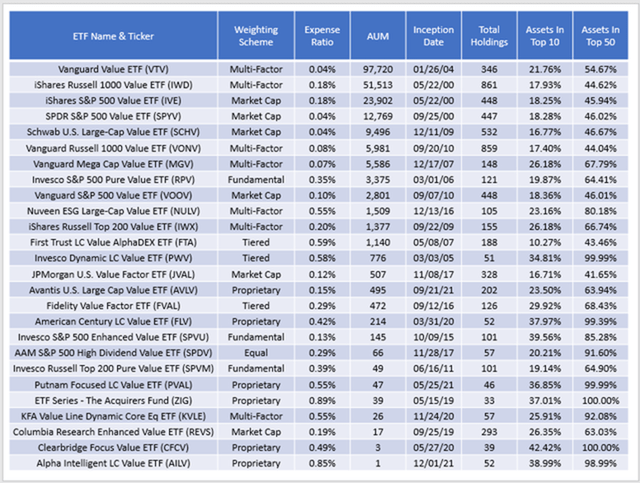
Large-cap value ETFs vary not only by their expense ratios but by their concentration levels. Some of the more concentrated ones are relatively new, with high expense ratios. In some instances, they might make sense, but I think the ones at the top of the list are better buy-and-hold products.
If one of these ETFs caught your eye, please consider its fundamentals and historical returns in the following table. I’ve included the most basic ones I think you should know about: beta, revenue growth, EPS growth, forward price-earnings ratio, and profitability score. The profitability score is on a ten-point scale I calculated myself using Seeking Alpha’s Profitability Factor Grade.
The Sunday Investor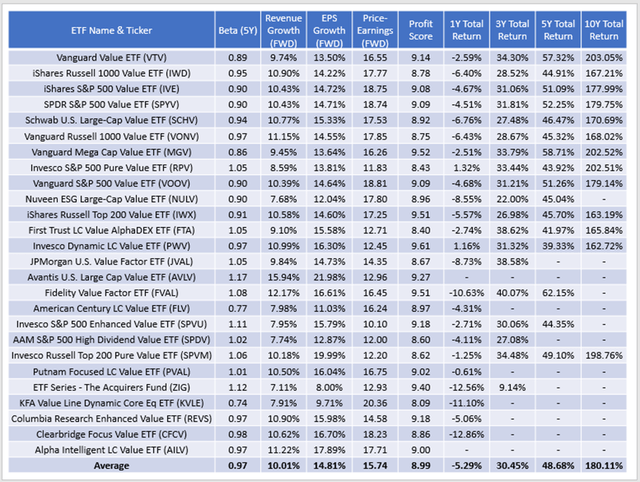
Among these large-cap value ETFs, the average five-year beta is 0.97, meaning they are slightly less volatile than the broader market. However, there’s quite a range. Well-diversified ETFs like the Vanguard Value ETF (VTV) and the iShares S&P 500 Value ETF (IVE) have betas near 0.90, while some of the lesser-known ones like the Avantis U.S. Large Cap Value ETF (AVLV) have betas as high as 1.17. Investors can use this simple metric to narrow their choices based on their risk tolerances.
One feature that’s common among high-beta value ETFs is a low price-earnings ratio. This surprises some investors because they assume the deeper value they go, the safer it becomes. However, that’s not the case at all. If you favor ETFs like the Invesco S&P 500 Enhanced Value ETF (SPVU), ensure you’re comfortable with wild swings. SPVU had a drawdown twice as worse as the SPDR S&P 500 ETF (SPY) in Q1 2020, with 37% more total volatility.
You can see analysts’ wide range in estimated sales and earnings per share growth for these ETFs. On average, they are 10.01% and 14.81% compared to 13.45% and 17.28% for SPY. Including growth metrics for value ETFs may seem odd, but they’ll matter if your positive outlook on value stocks turns out incorrect. Value investors substantially underperformed growth investors over the last decade, and there’s no guarantee that will reverse. My general recommendation is to veer closer to the middle and aim for a portfolio that scores well on various metrics to increase the chances of success.
This last point brings me to the profit score, which averages 8.99 for the category. For reference, SPY’s is 9.37, and the Invesco QQQ ETF (QQQ) is 9.69. It’s one piece of evidence that suggests value stocks aren’t of the same quality as SPY and QQQ. Still, a few have excellent scores, like the Vanguard Mega Cap Value ETF (MGV) and the iShares Russell Top 200 Value ETF (IWX). You’ll pay a slight premium for this quality, but it may be worth it.
Small- and Mid-Cap Value ETFs
There are 26 small- and mid-cap value ETFs on the market, but their collective AUM is less than half the large caps at $101 billion. However, the average expense ratio is lower (0.31% vs. 0.33%), with far fewer specialty funds trading. Still, you can choose Vanguard’s VBR and VOE for just 0.07%, and the level of diversification is likely sufficient for most investors.
The Sunday Investor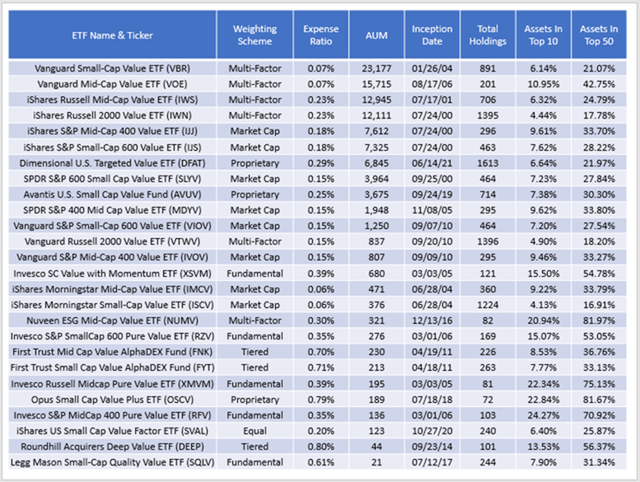
I think the weighting scheme for these ETFs is less critical because the absence of mega-caps makes them less top-heavy. It’s common for less than 40% of assets to be in a fund’s top 50 holdings, which isn’t the case for any ETF in the large-cap category.
Since diversification and concentration is less of an issue, I would place even greater importance on each ETF’s fundamentals. Here is the same table as before for these funds.
The Sunday Investor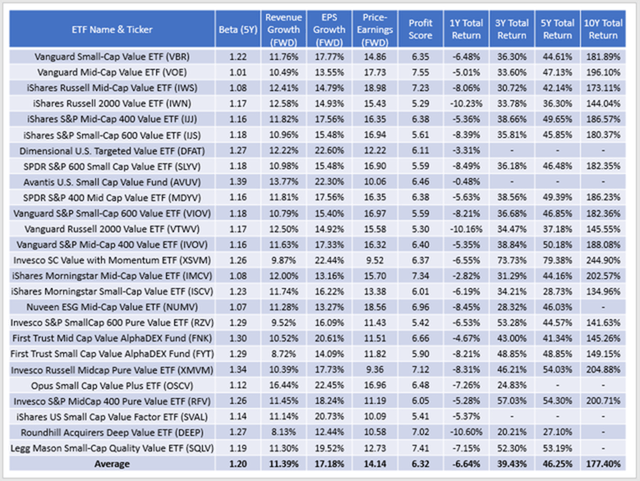
The first thing to note is the massive increase in the average five-year beta (0.97 to 1.20). Generally, there’s an inverse correlation between market capitalization and volatility, and these ETFs are often more volatile than QQQ and other leading large-cap growth funds. However, increased volatility isn’t necessarily bad, especially if you have a long-time horizon. The best-performing one in the category over the last ten years was the Invesco S&P SmallCap Value With Momentum ETF (XSVM), generating a 244.90% total return. That’s even better than SPY’s 238.59% gain and is evidence of the benefits of practicing size diversification.
With small- and mid-cap value ETFs, investors often receive more substantial growth at a cheaper valuation. But these benefits require a significant sacrifice in profitability. Because most ETFs have a profitability score below 7, an optimistic market is necessary to justify the added risk. The good news is that it happens regularly enough, as both of iShares’ small- and mid-cap ETFs have outperformed their large-cap counterpart over the last ten years.
Portfolio Visualizer
All-Cap Value ETFs
Finally, all-cap value ETFs are for those who want an all-in-one solution. There are 17 with a combined $24 billion in net assets, but the category is dominated by the iShares Core S&P U.S. Value ETF (IUSV) and the iShares Edge MSCI USA Value Factor ETF (VLUE).
The Sunday Investor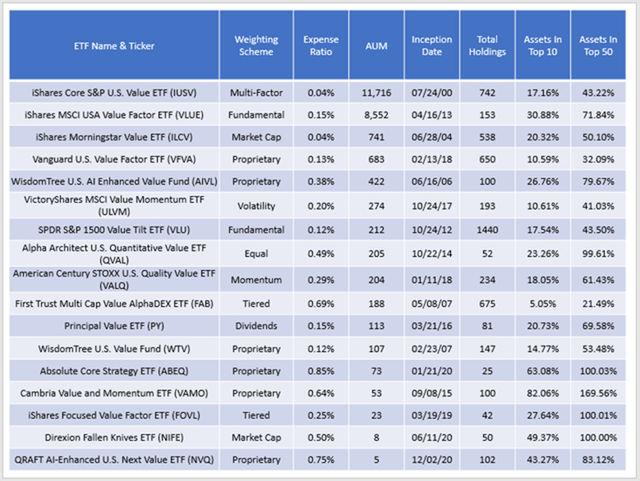
Some of these ETFs use tactical hedging strategies, which explains why their percentage of assets in the top 10 and 50 looks odd. Nevertheless, the biggest weakness of these funds is that they lack customization. For example, despite being factor and fundamental-weighted, IUSV and VLUE have 91% of assets in large-cap stocks. ILCV is even worse at 94% because it’s market-cap-weighted. As an alternative, I suggest owning a small-cap, mid-cap, and large-cap value ETF in your desired allocations.
As you might expect, the fundamentals for many of these ETFs are a blend of the two previous categories. The average five-year beta is 1.08, and many have a forward price-earnings ratio below 15. That’s more than eight points cheaper than SPY and nearly half the valuation of QQQ.
The Sunday Investor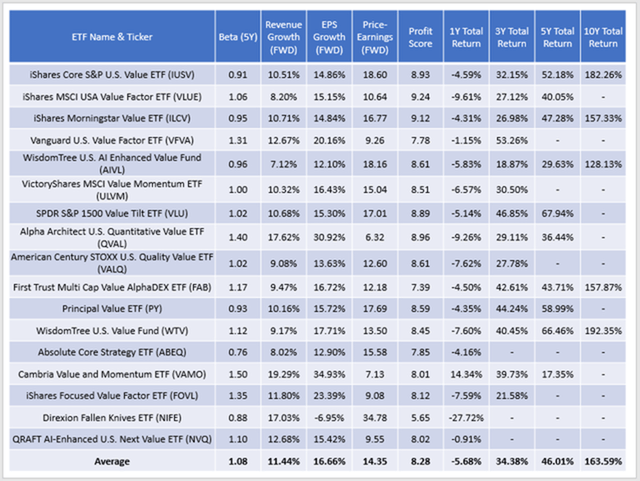
Only five have a ten-year trading history, with the WisdomTree U.S. Value Fund (WTV) performing best, generating a 192.35% total return through August. However, if I had to pick one today, it probably would be ILCV. Its 0.95 beta, 16.77x forward earnings valuation, double-digit revenue and earnings growth, and strong profitability score appears to have investors covered from multiple angles.
Conclusion
This article aimed to provide readers with relevant information on nearly 70 U.S. value ETFs in a concise format. Traditional ETF screeners help you narrow down funds by strategy, fees, assets, and the number of holdings, but I sought to supplement this with current fundamental data covering volatility, growth, valuation, and profitability. I hope readers can use this article as a reason to check out other articles on the ETFs authors have covered on Seeking Alpha. And, as always, if you’d like me to cover a specific one you’re interested in, please let me know in the comments section below. Thank you for reading.
[ad_2]
Source links Google News

