[ad_1]
AndreyPopov/iStock via Getty Images
Author’s note: This article was released to CEF/ETF Income Laboratory members on August 9th, 2022.
The Invesco S&P 500 Equal Weight ETF (NYSEARCA:RSP) is an equal-weighted S&P 500 index fund. RSP provides investors with comparable, arguably greater, diversification than market-cap weighted S&P 500 index funds, sports a relatively cheap valuation, and has outperformed since inception, a solid combination. RSP’s many benefits make it a strong investment opportunity, and a buy. With a 1.7% yield and average dividend growth, the fund is not an effective income vehicle.
RSP Basics
- Investment Manager: Invesco
- Dividend Yield: 1.65%
- Expense Ratio: 0.20%
- Total Returns CAGR (Inception): 11.22%
RSP – Overview
RSP is an S&P 500 index fund. The S&P 500 index is the most well-known equity index, investing in the 500 largest U.S. companies, subject to a basic set of profitability, liquidity, trading, and corporate governance criteria. Said index includes almost all large, well-known U.S. companies, including Apple (AAPL), Microsoft (MSFT), Exxon (XOM), JPMorgan (JPM), and Johnson & Johnson (JNJ). Said index provides investors with diversified exposure to the U.S. large-cap equity investment universe, through investments in hundreds of securities from all relevant industry segments.
S&P 500 components tend to be relatively safe, blue-chip investments: companies very rarely get large enough for inclusion into the index otherwise. This is an important benefit for the index, although I do believe diversification into smaller, riskier, companies to be a net positive.
RSP is an equal-weighted S&P 500 index fund, meaning all securities have the same weight: 0.20%. RSP’s diversified underlying index and weighting scheme results in an incredibly well-diversified fund, with exposure to hundreds of securities from all relevant industry segments. Industry exposures are not equal, as some industries are smaller than others, and have fewer relevant companies. These include energy, materials, and communication services. RSP’s industry exposures are as follows.
RSP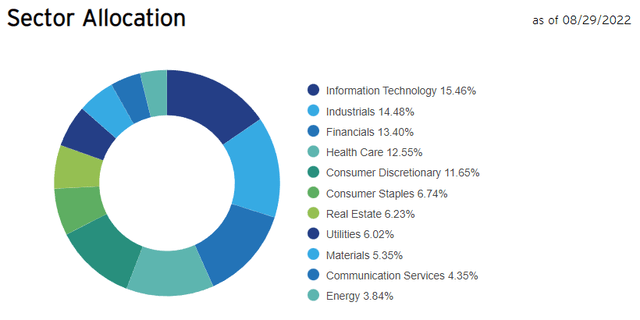
RSP’s diversified holdings decrease portfolio risk and volatility, and are a significant benefit for the fund and its shareholders. RSP is sufficiently diversified that the fund could function as a core portfolio holding: it includes almost everything an equity investor needs. Adding small-cap and international exposure would be ideal, but is not strictly necessary, in my opinion at least.
RSP – Equal-Weight Implications
RSP is an equal-weighted S&P 500 index fund.
Most S&P 500 index funds, including the SPDR S&P 500 Trust ETF (SPY) and the Vanguard S&P 500 ETF (VOO), are market-cap weighted funds, meaning security weights are dependent on market capitalizations. These funds invest an above-average proportion of their assets in large S&P 500 components, think companies like Apple and Microsoft, but invest very little in smaller components, like Etsy (ETSY) and Fox Corporation (FOXA).
RSP’s different weighting scheme has important implications for the fund and its shareholders. Let’s have a look at these.
Lower Tech Exposure
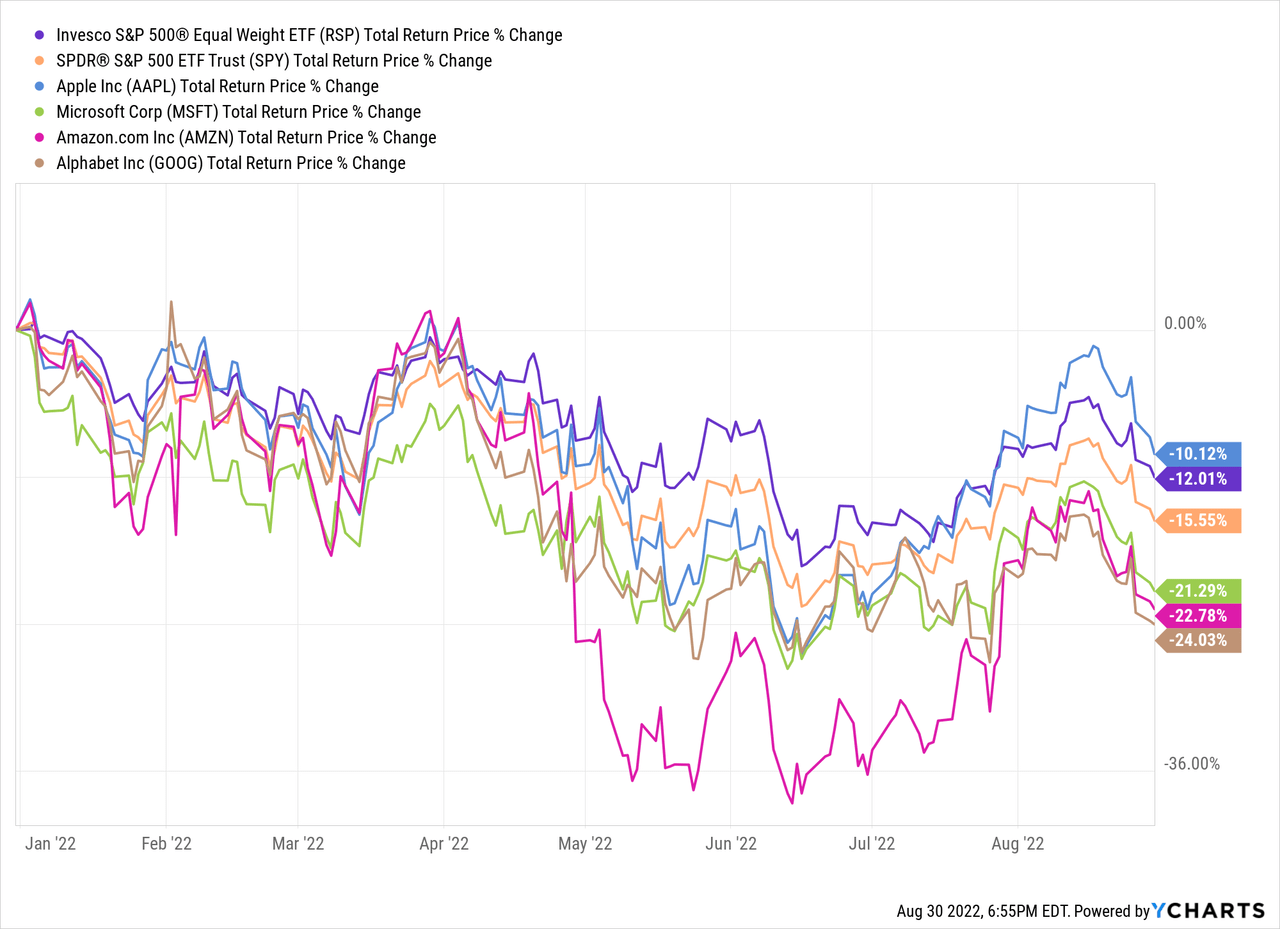
Market-cap weighted S&P 500 index funds invest a large proportion of their assets in mega-cap tech stocks. Just four companies, Apple, Microsoft, Amazon, and Google, make up 20% of these funds, a hefty amount for an index with 500 different components. These companies exert an outsized influence on the performance of these funds, for good and for ill.
RSP, on the other hand, invests just 0.80% of its assets in these four companies, same percentage as its peers. As such, RSP is less dependent on the performance of these companies for its returns, and should be less negatively impacted when said companies post losses or underperform. Said companies have underperformed for months now, during which RSP has outperformed market-cap weighted S&P 500 index funds, as expected.
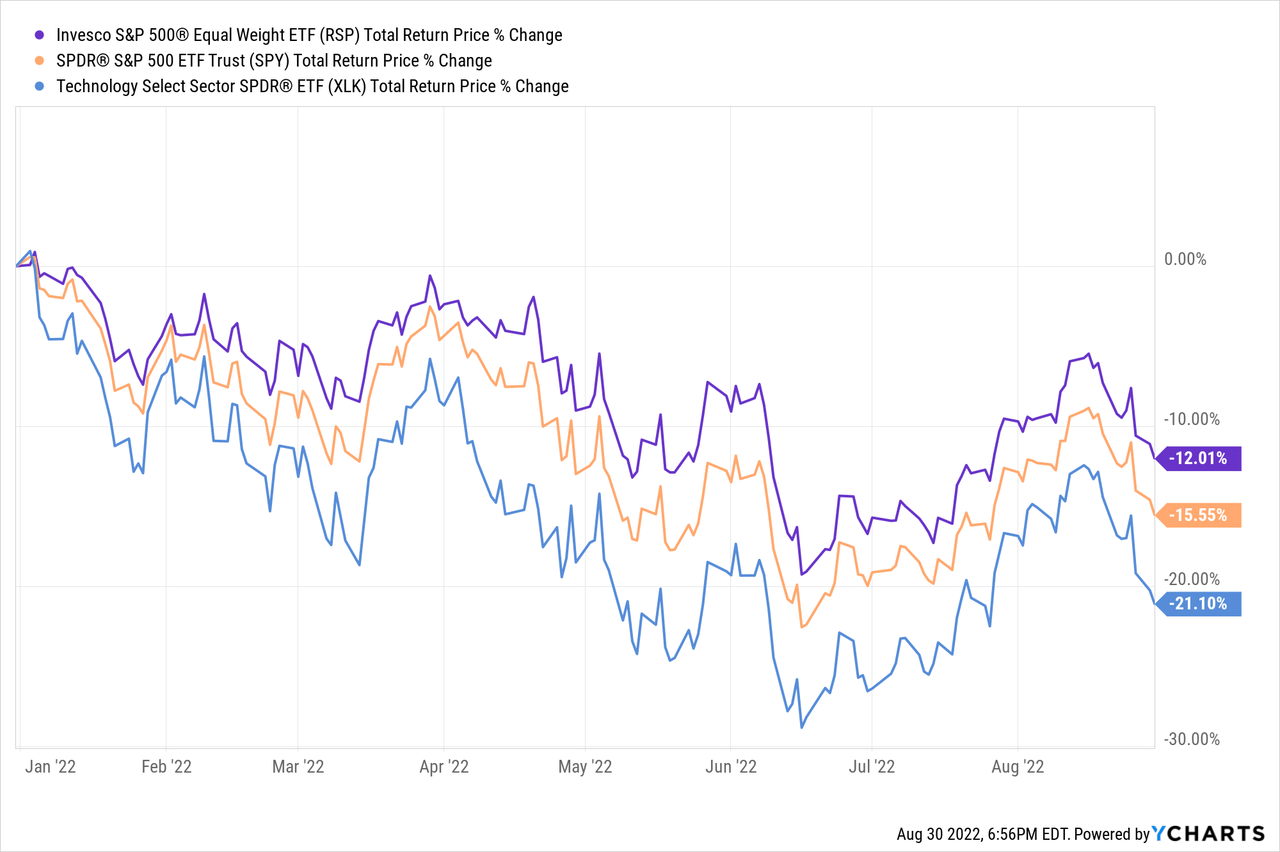
A corollary to the above is that market-cap weighted S&P 500 index funds tend to be overweight tech, as there are several mega-cap tech stocks out there, while RSP is not. As such, RSP tends to perform particularly well when tech underperforms, as has been the case YTD.
Greater Exposure to Smaller Companies
Market-cap weighted S&P 500 index funds invest a tiny proportion of their assets in the smaller index components, like Etsy and Fox.
RSP, on the other hand, invests in these smaller components the exact same amount that it invests in the larger companies: 0.20% per stock. This means that RSP’s average holding is quite a bit smaller than average. RSP currently has a weighted average market-cap of $69B, versus a $498B figure for the S&P 500, a very large, significant difference.
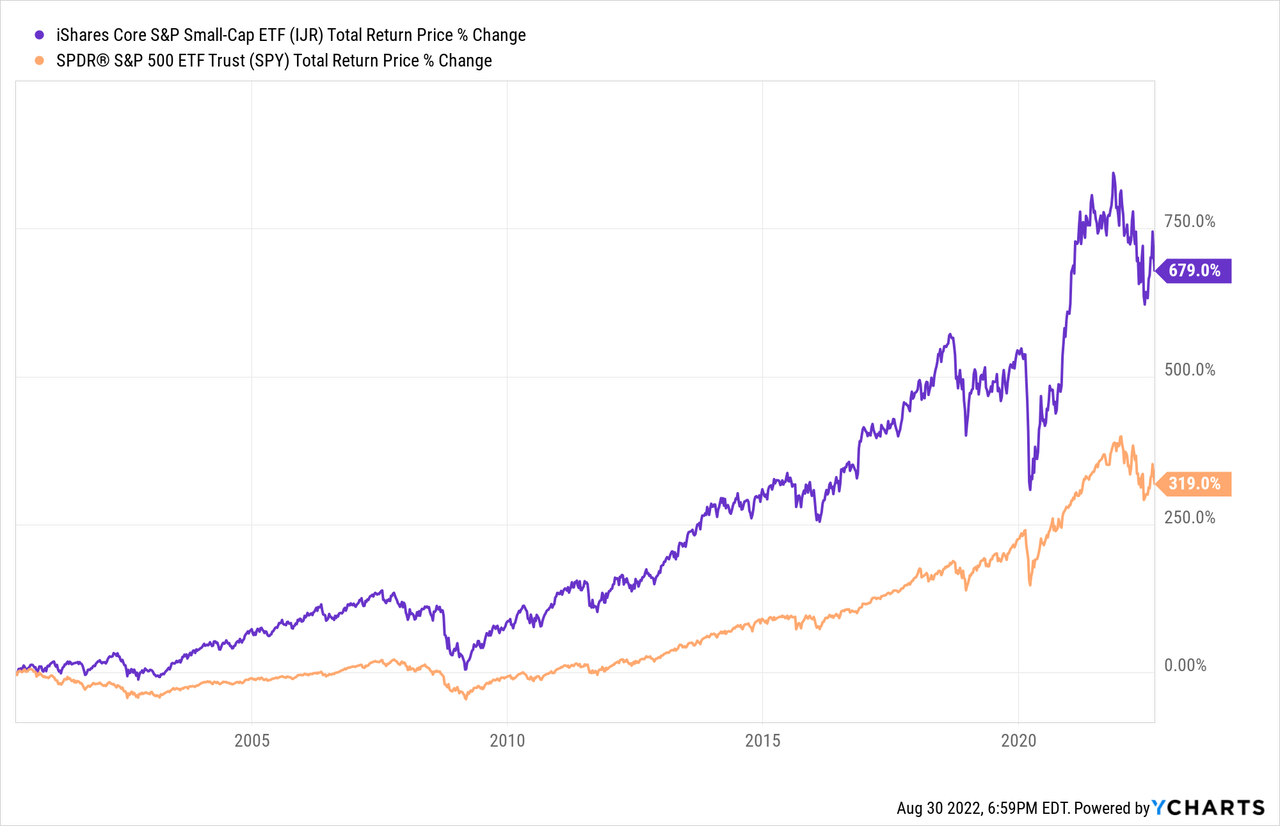
Smaller companies tend to be riskier, as these tend to have more concentrated, less diversified revenue streams, as well as weaker balance sheets. Smaller companies tend to outperform too, as these tend to experience greater growth (lower starting base) and trade with discount valuations. As evidence, small-cap S&P 500 funds have outperformed benchmark indexes for decades, although performance is incredibly volatile, and outperformance is not consistent.
Cheaper Valuation
RSP invests more heavily in smaller companies, at least compared to its peers. Smaller companies tend to trade with discount valuations, as smaller companies tend to be riskier than larger ones, and perceived as such by investors. RSP’s greater exposure to these companies leads to a slightly cheaper valuation than average, although the difference is not incredibly significant.
Fund Filings – Chart by author
RSP’s cheaper valuation could plausibly lead to above-average returns, contingent on valuations normalizing. Which brings me to my next point.
RSP – Performance Analysis
RSP’s performance track-record is reasonably good, if perhaps not outstanding. The fund has outperformed market-cap weighted S&P 500 index funds since inception, due to the fund’s greater exposure to smaller, high-growth companies. Performance is somewhat spotty, and somewhat dependent on the relative performance of the tech industry, but the long-term track-record is definitely positive. Performance has been particularly strong these past few months, as tech valuations normalize. Performance was quite weak during the 2010s, as tech stocks soared. RSP’s long-term performance track-record is quite good, but there are definitely long stretches of time during which the fund underperforms.
RSP
RSP – Dividend Analysis
Finally, a quick note on the fund’s dividend.
RSP currently yields 1.7%. It is a low yield on an absolute basis, but not terribly different from those of its peers. RSP technically yields a bit more than its peers, but the difference is small, quite recent, and could simply be the result of dividend volatility (quite common for ETFs).
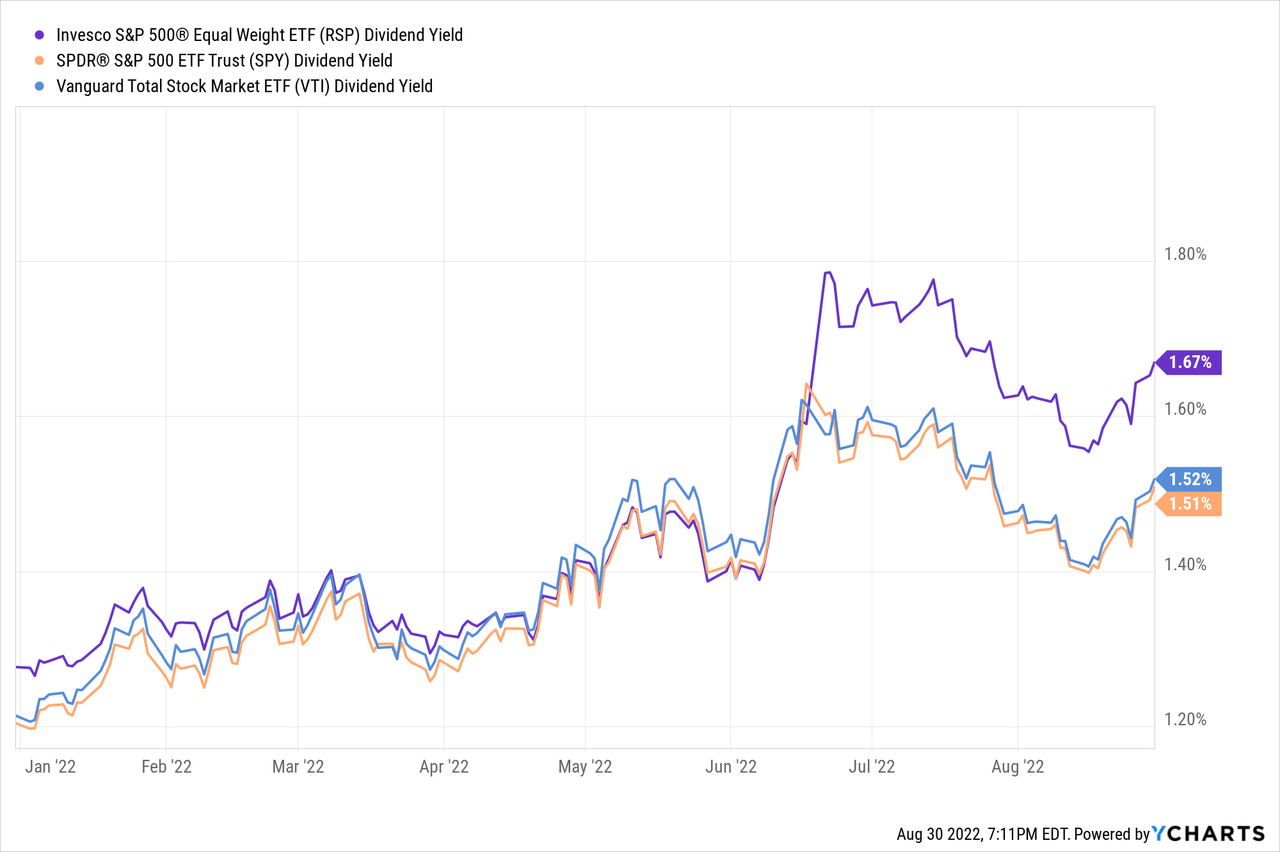
RSP’s dividend has seen strong growth since inception, and moderately higher than average.
Seeking Alpha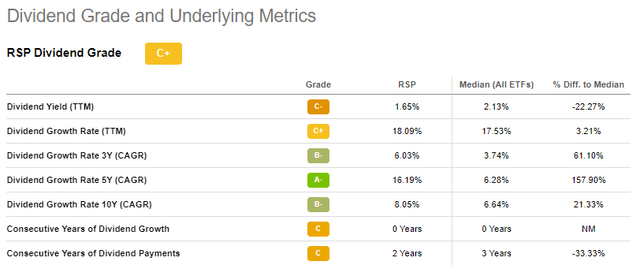
Strong, consistent dividend growth means long-term investors do end up receiving a reasonably good amount of income throughout the years, but nothing too outstanding. As an example, the fund sports a 10Y yield on cost of 4.6%, almost triple its current TTM dividend yield. For a fund, tripling a dividend in a decade is outstanding, but as RSP’s yield starts on a very low base, the effect is somewhat muted.
Seeking Alpha
RSP’s dividend yield is more or less average. The fund’s dividend growth track-record is somewhat good, somewhat beneficial for investors, but nothing too out of the ordinary. As such, the fund is simply not an effective income vehicle.
Conclusion
RSP’s diversified holdings, cheap valuation, and strong performance track-record, make the fund a buy.
[ad_2]
Source links Google News

