[ad_1]
baona/iStock via Getty Images
Investment Thesis
Over the last year, the iShares Select Dividend ETF (NASDAQ:DVY) has consistently been one of the top-performing dividend ETFs on the market. This 100-stock fund has paid dividends for 18 consecutive years, has grown them at an annualized rate of 7.11% per year, and currently yields 2.90%, making it a popular choice with over $23 billion in assets under management. I previously recommended DVY in November and January, but with its Index reconstituting in March, I felt it prudent to provide an update. Essentially, this article aims to challenge my previous bull thesis, so with that said, let’s begin the analysis.
ETF Overview
Strategy
DVY tracks the Dow Jones U.S. Select Dividend Index, selecting the top 100 U.S. dividend-paying securities (excluding REITs) after applying the quality screens noted below:
- dividends per share greater than the five-year average
- five-year average dividend payout ratio less than 60%
- five-year uninterrupted dividend track record
- positive trailing twelve-month earnings per share
The dividend screens seem slightly relaxed, but the earnings screen gives DVY a quality edge other high-dividend ETFs don’t have. Still, I should mention how the Index grandfathers in current constituents regardless of their dividend growth rates, payout ratios, and current-year earnings per share. You may find these exceptions primarily in the Energy sector, but as we’ve found in 2022, this relaxed policy can work in your favor.
Constituents are weighted based on their indicated yields, giving the Index a somewhat equal-weight feel. When an Index weights constituents by market capitalizations or aggregate dividends, it becomes close to a large-cap dividend ETF with higher fees. DVY’s 0.38% expense ratio isn’t cheap, but there’s a good chance it holds stocks you don’t already own. Later, I’ll compare its holdings by industry with several other popular dividend ETFs to help you determine whether DVY can act as a good complementary fund.
Finally, the Index reconstitutes annually in March, meaning DVY has potentially changed significantly from a fundamentals perspective since my last review. I’ll provide a list of changes shortly, but first, let’s look at DVY’s sector exposures compared to the SPDR S&P 500 ETF (SPY) and three other dividend ETFs you might own.
Sector Exposures and Top Holdings
The three dividend ETFs I’ve chosen all have 0.06% expense ratios:
- Vanguard Dividend Appreciation ETF (VIG)
- Vanguard High Dividend Yield ETF (VYM)
- Schwab U.S. Dividend Equity ETF (SCHD)
Morningstar places VIG in the Large Core category, while VYM and SCHD are in the Large Value category. DVY falls into the Mid Value category; however, while this may have been typical of its past selections, about 75% of current constituents meet S&P’s $13.1 billion large-cap threshold.
Morningstar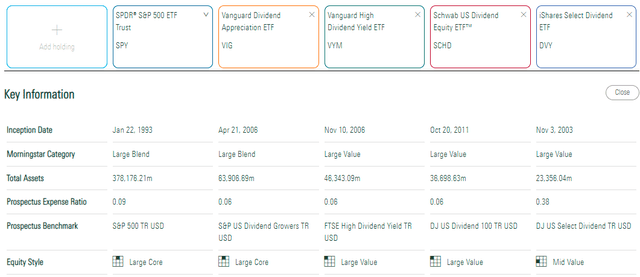
From a sector exposure perspective, DVY is unique for its low allocation to Health Care stocks. With a weighting of just 4.40%, it’s about 10% less than its four comparisons. However, it’s more than one-quarter Utilities, and it has a higher-than-average exposure to Energy and Materials, two sectors that provide a good hedge against inflation. DVY is also light on Technology, which has undoubtedly served investors well given the latest downturn.
Morningstar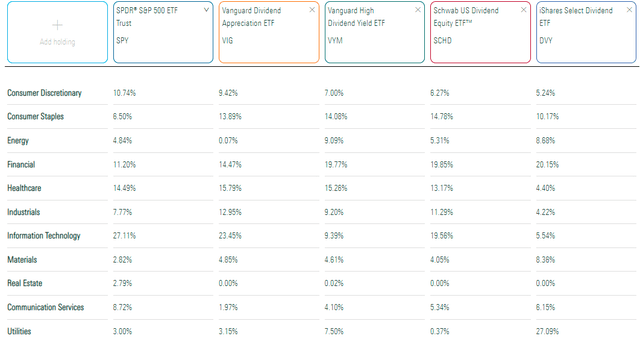
DVY’s top ten holdings total only 19.01% of the ETF, so it’s challenging to assess the fund by only evaluating the fundamentals of these companies. However, there are quite a few Energy stocks included, like Valero Energy (VLO) and ONEOK (OKE), and the only Technology stock on this list is the low-risk IBM (IBM).
iShares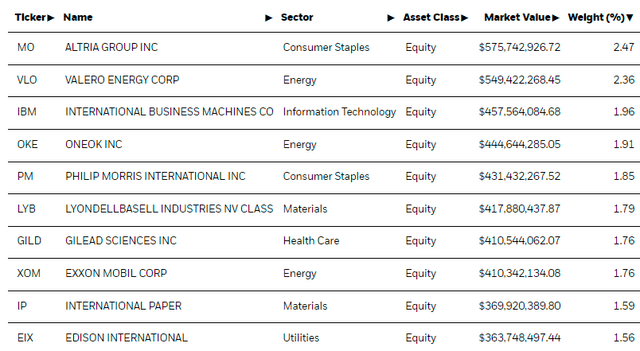
Dividends
DVY’s trailing dividend yield is 2.90%. There’s a legitimate argument for whether that qualifies as high-yielding security, but it’s relatively high in the pure equity ETF universe. I track 65 dividend ETFs, and DVY ranks 16th highest, while VIG, VYM, and SCHD rank 64th, 33rd, and 26th, respectively.
Seeking Alpha gives DVY an “A-” Dividend Grade for its above-average yield and 18 years of consecutive dividend payments. However, its growth rates appear lower than other ETFs. I can’t speak to the calculations made for all ETFs, but I can say that DVY’s current constituents have grown their dividends at an annualized rate of 7.59% in the last five years. That’s good enough for 47th place in my database, so I think this is probably enough data to confirm that DVY is far from your best dividend growth option. If that’s a deal-breaker for you, I think you’ll like SCHD and the iShares Core Dividend Growth ETF (DGRO) more.
Seeking Alpha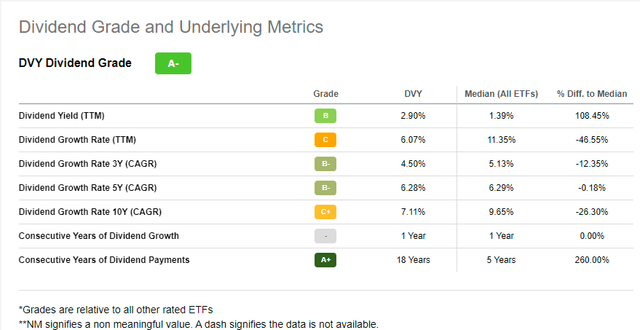
The table below highlights the dramatic decline in DVY’s yield over the last few years. DVY ended 2021 yielding 3.14%, its lowest in history (not counting the partial year in 2003). If using yield as a measure of relative valuation, asset prices still appear incredibly high. Total distributions paid were $3.8238 per share last year, below 2019’s payouts. The pandemic has made it challenging to gauge valuation, as waiting for DVY’s yield to go back above 4% probably isn’t doable for most investors.
Seeking Alpha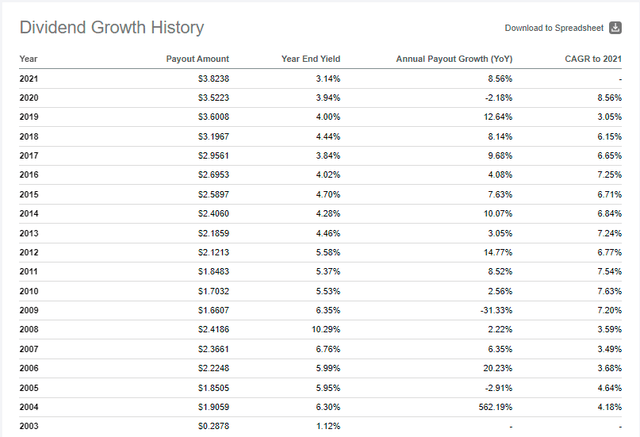
Performance
In May, DVY was the sixth-best-performing dividend ETF with a 5.34% total return. Over the last three-, six-, and twelve-month periods, DVY ranked 10th, 9th, and 8th, respectively, out of 65 ETFs. It’s quite a reversal from five years ago, where DVY ranks just 20th out of 44 ETFs with enough history. I think it just shows how relying on past performance, however tempting it may be, can often cause you to miss out on great opportunities. The table below provides historical performance for the 25 largest dividend ETFs by assets under management, sorted by their one-year returns. I think you’ll agree that DVY’s strategy has worked quite well in the current environment.
The Sunday Investor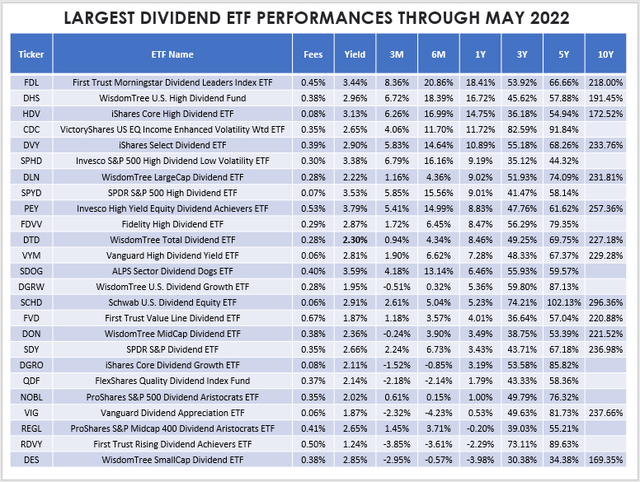
Relying on past performance is even more misleading if you extend the lookback period to DVY’s inception. At the time of launch, the First Trust Value Line Dividend ETF (FVD) was DVY’s only contender, at least out of the surviving ETFs. Anyone looking at DVY would likely conclude that it’s merely a more expensive, more volatile, and worse-performing choice.
Portfolio Visualizer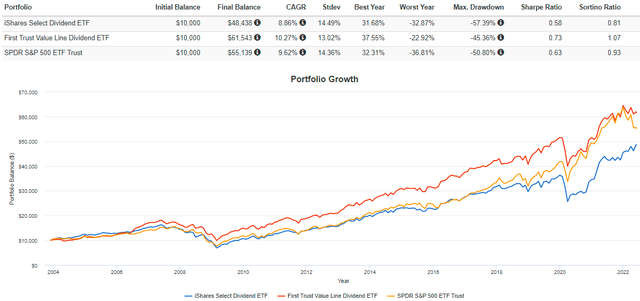
However, an analysis of the two ETFs’ fundamentals reveals that:
- DVY has a forward price-earnings ratio that’s more than five points cheaper
- DVY’s constituents yield nearly 1% more
- Estimated revenue and earnings per share growth rates are almost identical
I hope more readers will begin to rely more on an ETF’s current fundamentals rather than past performance. Keeping an open mind to the entire dividend ETF universe is your best chance of success.
Fundamental Analysis
March Reconstitution
Only four stocks were added last March, as follows:
- Conagra Brands (CAG): Packaged Foods & Meats
- UGI Corp. (UGI): Gas Utilities
- Chemours (CC): Diversified Chemicals
- MSC Industrial Direct (MSM): Trading Companies & Distributors
While six stocks were deleted from the Index:
- CF Industries (CF): Fertilizers & Agricultural Chemicals
- People’s United Financial (PBCT): Regional Banks
- QUALCOMM (QCOM): Semiconductors
- DT Midstream (DTM): Oil & Gas Storage & Transportation
- Organon & Co. (OGN): Pharmaceuticals
- Kyndryl Holdings (KD): IT Consulting & Other Services
This activity is remarkably quiet given how DVY had a portfolio turnover rate of 55% the year prior. However, from 2017 to 2020, turnover was only 19%, 28%, 21%, and 6%, so perhaps this reflects how reconstitutions usually are. Most rules-based ETFs have high turnover, and the fact that DVY tends to change up its holdings infrequently is a positive feature for passive investors.
Industry Snapshot
The following table highlights several dividend-related metrics for DVY’s top 20 industries. For reference, I’ve compared it with SCHD since it’s one of the best dividend ETFs on the market, has a low expense ratio and has a nearly identical dividend yield.
The Sunday Investor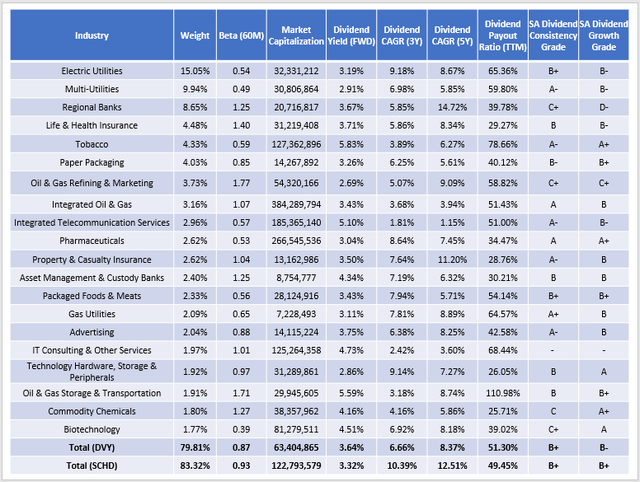
At a high level, we see that DVY’s five-year beta of 0.87 suggests it’s less volatile than SCHD, and its weighted-average market capitalization is about half. While still firmly in the large-cap territory, there are several mid-cap insurance, asset management, and gas utility stocks. Thirty-seven don’t meet S&P’s threshold for large-cap status, but they total just 25.78% of the ETF.
DVY’s constituents have a gross yield that’s 0.32% higher, but due to the differences in fees (0.38% vs. 0.06%), this advantage is perfectly negated. As mentioned before, DVY isn’t a strong dividend growth ETF. Its constituents have grown dividends at an annual rate of just 8.37% in the last five years compared to 12.51% for SCHD. These metrics are reflected in DVY’s worse Seeking Alpha Dividend Growth Grade (B- vs. B+).
Company Snapshot
I also want to provide some color on DVY’s top 20 companies. They total just one-third of the ETF, but I think the following table highlights why DVY has been successful this year. It’s a low-volatile, low P/E fund, and the market hasn’t punished its low-growth stocks. DVY’s estimated EPS growth rate of 10.99% is only 45th best out of 65 dividend ETFs, and virtually every fund with lower growth potential is in the high yield category. When market sentiment turns positive again, I think investors will do much better with a more balanced ETF like SCHD and DGRO.
The Sunday Investor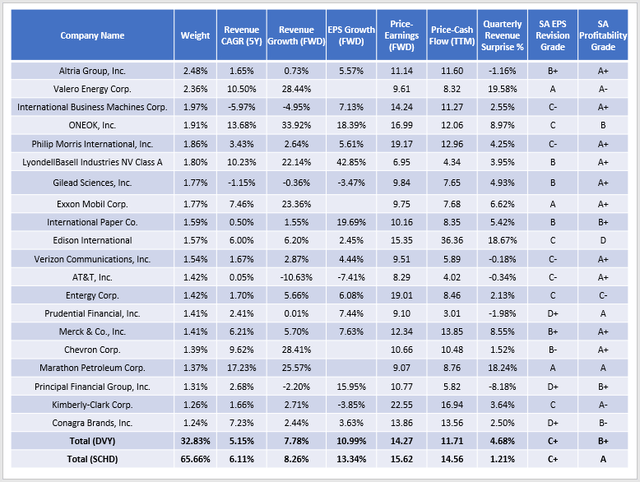
However, for now, DVY’s constituents have a lot of momentum. Energy and Utilities stocks continue to be favored after an impressive earnings season that saw Valero Energy and Edison International (EIX) each post revenue surprises near 20%. According to Yardeni Research, these two sectors performed best last quarter, easily outpacing the 2.50% revenue surprise for the S&P 500 Index. Interestingly, the mid-caps did even better on the Energy side, so that’s where an ETF like DVY can come in handy.
Yardeni Research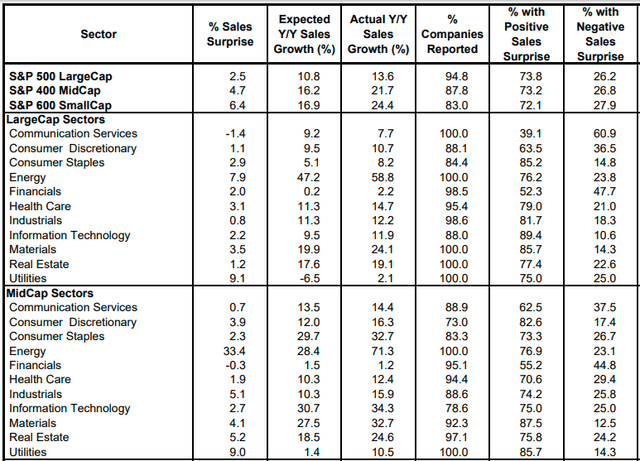
Fund Overlap
A neat third-party tool available on the ETF Research Center lets you compare the overlap between any two ETFs. When comparing DVY against the most popular dividend ETFs by asset management, it reveals the following overlap by weight:
- Vanguard Dividend Appreciation ETF (VIG): 8%
- Vanguard High Dividend Yield ETF (VYM): 29%
- Schwab U.S. Dividend Equity ETF (SCHD): 28%
- iShares Core Dividend Growth ETF (DGRO): 16%
- SPDR S&P Dividend ETF (SDY): 20%
- iShares Core High Dividend ETF (HDV): 21%
This analysis shows that DVY can act as a decent compliment to any one of these ETFs. However, I want to take this analysis further and compare the industry overlap instead. The reason is that many stocks in the same industry have similar profiles, and swapping out one for another doesn’t do much good from a diversification standpoint. However, if you can build a portfolio of dividend-paying stocks from a variety of unique industries, there’s an excellent chance you’ll lower your risk. You can use the following table to see what market segments you’re potentially missing out on and if adding DVY or any of the six ETFs listed above makes sense.
The Sunday Investor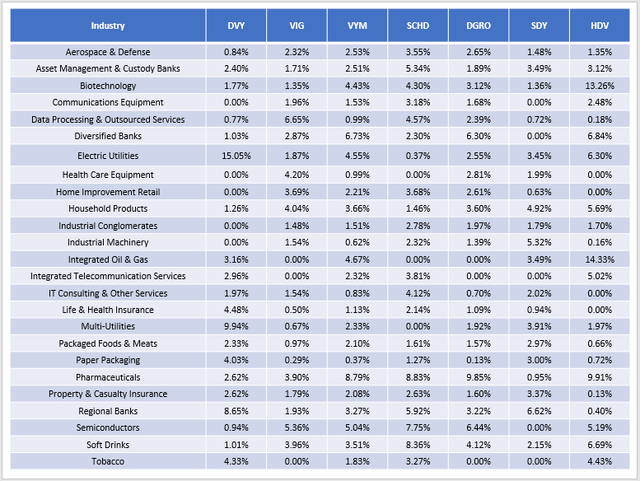
As shown, DVY is the only ETF with significant exposure to Utilities, so if that’s an area you’re interested in, it’s a good fit. Alternatively, you can keep it simple and add a sector ETF like the Utilities Select Sector SPDR ETF (XLU) to your portfolio. I just finished reviewing the iShares U.S. Utilities ETF (IDU), where I reiterated my positive outlook on the sector. Most of the other ETFs are light on Energy, too, except for HDV, which is why it’s performed so well lately.
Investment Recommendation
DVY is likely to be one of the better performers for the next couple of months as its constituents take advantage of a nervous market that’s less focused on growth and more focused on risk and valuation. Its Energy and Utilities stocks had a great quarter, and DVY benefits from holding some mid-cap stocks. With a 14.27 forward price-earnings ratio, a 0.87 five-year beta, and a solid 2.90% yield, it checks many important boxes.
However, DVY falls short on revenue, earnings, and dividend growth. This will hinder the ETF when market sentiment turns positive again, and readers should know that could happen as early as next quarter. In Q1 2022, the S&P 500 reversed a three-quarter decline in earnings surprises, and while revenue surprises were the same as in Q4 2021, it’s still an optimistic signal. Given that, I also suggest considering more balanced ETFs like SCHD and DGRO that still have great valuations but are more likely to participate in any bull markets. Their fees are much lower than DVY’s, and I don’t think you can go wrong with either over the long run.
[ad_2]
Source links Google News

