[ad_1]

Galeanu Mihai/iStock via Getty Images
Is There A Better Way to Invest in Growth than QQQ?
I’ve spent a lot of time lately looking at the Invesco QQQ ETF Trust (NASDAQ:QQQ), trying to determine if it still is the aggressive tech growth ETF that so many investors think it is. You can read about my findings in this recent article, Is QQQ Still a Tech Growth ETF?
My conclusion has been that the small number of mega cap stocks that dominate QQQ have become so huge that it will be quite a challenge for them to continue growing earnings at the double digit rate investors have become accustomed to seeing. That led me to wonder if there was a better way to invest in U.S. growth stocks going forward.
QQQ is something of an accidental growth ETF. It tracks the Nasdaq 100 index, which holds the 100 largest non-Financial Sector stocks, ranked by market cap weight, that are listed on the Nasdaq stock exchange. Because the Nasdaq exchange was less prestigious and cheaper to list on in the 1980s and 1990s, it became the exchange of choice for the many small tech companies that went pubic during those decades. These small companies included the likes of Microsoft (MSFT), Apple (AAPL) and Amazon (AMZN). Their success made investors identify the Nasdaq 100 with disruptive, innovative tech companies, making many more new Tech companies list on the Nasdaq rather than on the older New York Stock Exchange.
But it isn’t 1998 anymore and the companies that dominate QQQ now have market caps over $1 Trillion. They are no longer disruptive upstarts but well on the way to being the new Blue Chips. As I pointed out in a previous article, most of the FAANGs, which have made an investment in QQQ so profitable over the past decade, are now forecast to see their earnings growth slow. Apple’s forecast annualized growth rate over the next two years is only 7.69% though its Price/Earnings ratio right now is still a very growthy 25.18 (P/E data used here is sourced from FactSet as reported by Fastgraphs.) Amazon’s forecast growth rate is barely 10% though its P/E ratio is a hefty 51.21.
Besides that, when I look past the well-known stocks that make up more than half of the value of QQQ to see what else it holds, I find a lot of semiconductor and computer services firms about which I know little, and whose Fastgraphs do not impress me as showing they are well valued.
So because I am an investor who would like to give my portfolio a growth tilt for the next several decades, I have been asking myself if there is a reasonably large, actively traded ETF alternative that would give me a better way to invest in the growth stocks of the future.
Quality, Profitable Companies Hold Up Best in Challenging Markets
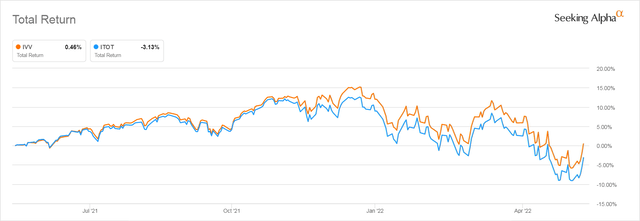
The recent market contraction has reinforced my belief in the value of investing in companies that are profitable. When we look at how the S&P 500’s performance has compared to that of indexes that track the Total Stock Market we can see this clearly. The iShares Core S&P 500 ETF (IVV) tracks the S&P 500 index, which requires a history of positive earnings for inclusion. The iShares Core S&P Total U.S. Stock Market ETF (ITOT) tracks an index that includes most of the stocks trading in the U.S. whether profitable or not. You can see below how they have performed over the past 12 months.
The S&P 500 (IVV) Has Lost Less than Total Stock Market ETF (ITOT)
Seeking Alpha
The benefit of that profitability screen for the broad market index in challenging times made me wonder if an ETF that tracks the growth stocks held by the S&P 500 might be a better way to invest in growth going forward.
The S&P 500 Growth Index Requires Profitability and Some Degree of Earnings Growth
S&P Global provides an index designed to track the Growth component of its broader S&P 500 Index. The S&P 500 Growth Index is designed to “… measure growth stocks using three factors: sales growth, the ratio of earnings change to price, and momentum.”
The S&P 500 Growth index currently holds 240 stocks which were selected out of the 502 stocks currently held by the S&P 500 index. As I have explained in several other articles, the S&P 500 is not an entirely passive index. Though to be considered for inclusions, stocks have to pass some algorithmic screens including the requirement that the company have a history of profitability, only those stocks that have made it through the screens and have then been selected by a human committee are allowed to enter the index.
A moment’s thought suggests it is highly unlikely that almost half of all the stocks in the S&P 500 are actually growth stocks. As I have explained in greater detail in an October 2021 article, SPY vs. SPYG: How to Compare These Two ETFs, the reason so many stocks are included in the index is that the methodology used to decide what stocks get included in the S&P 500 Growth Index is pretty crude. After a lot of fancy math that ranks each stock in the S&P 500 based on some growth and value criteria, all the stocks are ranked on a continuum stretching from lots of growth to lots of value and then assigned to one style group or the other. Once in the index, they are ranked by market cap.
As a result, the S&P 500 Growth index does hold quite a few stocks that really just fall into the no man’s land of “not quite growth, and not quite value” but have had to be put into one or the other category because they trend slightly more in the direction of the style chosen.
This is sloppy and means that the S&P 500 Growth index does hold some stocks we can only think of as “growth traps.” But then QQQ, despite its reputation, follows an index that imposes no requirement that the stocks it holds be growth stocks, only that it be among the stocks listed on the Nasdaq exchange with the largest market caps.
If we are going to choose our growth ETF from among the largest, most heavily traded ETFs we are going to have to accept a certain amount of compromise.
Of the ETFs that Track the S&P 500 Growth Index, SPYG Is The Better Choice
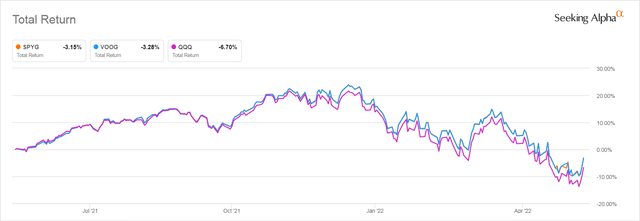
There are two ETFs that track the S&P 500 Growth Index. One is the SPDR Portfolio S&P 500 Growth ETF (NYSEARCA:SPYG) and the other is the Vanguard S&P 500 Growth ETF (VOOG). You can see how they have performed over the past year during which growth stocks have suffered a significant correction that for some has turned into a full bear market.
SPYG, VOOG, and QQQ Performance Over the Trailing 12 Months
Seeking Alpha
As you can see, both the S&P 500 Growth ETFs have done far better than QQQ over the past year as overvalued companies with poor earnings histories have been punished by investors
Between the two ETFs that track the S&P 500 Growth index, SPYG has slightly outperformed VOOG. The reason for this is largely that VOOG’s 0.10% expense ratio is more than twice as high as SPYG’s 0.04% expense ratio.
Vanguard has kept VOOG’s expense ratio high because it does not want investors investing in it. Investors who look at its product page on the Vanguard website are told to “Consider Vanguard Growth ETF, which tracks the same market segment at a lower cost.”
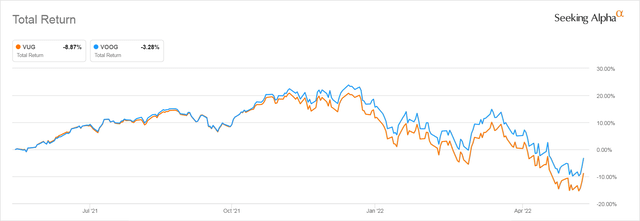
However, the Vanguard Growth ETF (VUG) is a very different index. It holds a subset of a custom CRSP Total U.S. Stock Market Index tracked only by Vanguard ETFs. That index is cheaper for Vanguard to license than are the S&P Global Indexes. But VUG is the Growth equivalent of the Total Stock market, with no screening applied to its stocks, many of which have no history of profitability. It has woefully underperformed VOOG over the past year’s correction during which VUG has lost 8.87% of its value. That is more than twice the loss of 3.28% suffered by the S&P 500 Growth ETF, VOOG.
The S&P 500’s Profitability Screen Paid Off During the Correction
Seeking Alpha
This tells us that just as was the case with the broader iShares Core S&P 500 ETF compared to the iShares Core Total Market ETF graphed above, the S&P 500’s screening criteria and the human intervention of its selection committee deliver during times like these, when the market isn’t being driven by euphoric momentum.
Backtesting May Be Deceptive
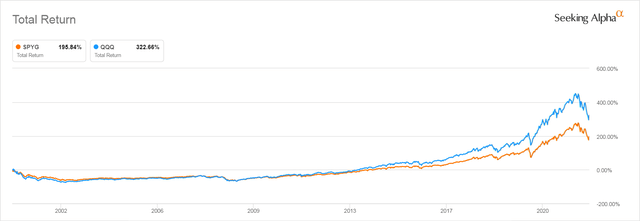
Backtesting shows that since SPYG’s inception in October of 2000, QQQ has greatly outperformed SPYG except during the years following the collapse of the dot.com boom.
SPYG vs QQQ Total Return since October 2000
Seeking Alpha
But before you assume that outperformance will continue, you have to consider that that past outperformance was driven by the surging growth of the once-young companies that are now the top 10 mega cap stocks in QQQ. Several of those stocks, including Amazon (AMZN), Facebook (FB), and Tesla (TSLA) did not enter the S&P 500 until they had already achieved mega cap status. This deprived investors in SPYG of the huge gains that were made by buying these stocks when they were much smaller and had their growth ahead of them.
But now fully 40% of the total value of QQQ is contributed by just four trillion dollar companies: Apple (AAPL), Amazon (AMZN), Microsoft (MSFT), and the two share classes of Alphabet (GOOG) (GOOGL). It will be hard for any younger company, no matter how innovative, to make much of a dent in its performance.
Comparing the Top Holdings of SPYG and QQQ Shows Great Similarity
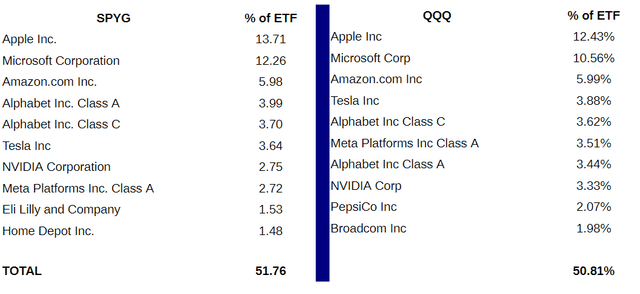
This made me wonder whether SPYG suffered from the same problem, given that the top stocks in the S&P 500 are almost identical to those in QQQ. Below you can see how similar the Top 10 holdings by weight in both SPYG and QQQ are right now.
Top 10 Stocks by Weight in SPYG and QQQ as of May 26, 2022
SSGA.com, invesco.com, table by the author
Alas, we see that the same four mega cap stocks dominate both ETFs, even though there are two and half times more stocks in SPYG. In fact, the Big four, Apple, Microsoft, Amazon, and the Alphabets make up 41.64% of the total value of SPYG, 1.64% more than they represent in QQQ!
The holdings of the two ETFs only diverge when we get to the 9th and 10th rankings. SPYG ranks Lilly (LLY) and Home Depot (HD) in the top 10, but because those companies aren’t listed on the Nasdaq exchange, QQQ lists two other stocks, PepsiCo (PEP) and Broadcom (AVGO) that are.
How Growthy are the Top 10 stocks that Differ Between QQQ and SPYG ?
Fastgraphs tells us that SPYG’s #9 stock ranked by weight, Lilly, has a P/E now of 39.40 and that analysts expect it to grow earnings at an annualized rate of 13.26% through the end of 2024. In contrast, QQQ’s #9 stock ranked by weight, PepsiCo, has a P/E ratio of 26.79 and is expected to grow earnings by an annualized rate of 7.70% through 2024. Both stocks are heavily overvalued, but Lilly, which has a newly approved potential blockbuster weight loss drug, Mounjaro, is expected to grow earnings at almost double the rate of PepsiCo going forward.
SPYG’s #10 stock, Home Depot (HD), currently has a P/E ratio of 19.46 and is expected to grow earnings at an annualized rate of only 6.43%. QQQ’s #10 stock, Broadcom (AVGO), has a P/E of 17.64 and is expected to grow earnings at an annualized rate of 15.74%. It appears to be a better growth stock than Home Depot, except that the forecast earnings are heavily impacted by 2022 having abnormally high earnings growth of 31.70%, while growth in subsequent years is only estimated to be at an annualized rate between 8% and 9%.
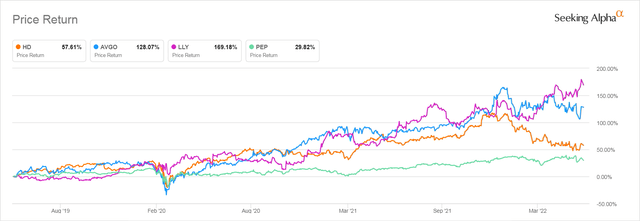
The 3-Year History of these stocks suggests that SPYG’s were better, even though Home Depot’s predicted earnings look bad as it is currently being punished because investors worry it can’t keep up with its COVID era earnings success.
I would be happier holding SPYG’s 9th and 10th largest holdings.
SPYG’s LLY and HD vs. QQQ’s PEP and AVGO 3yr Price Return
Seeking Alpha
Which Stocks Are Not Held by Both ETFs?
Looking past the top 10, I was curious what other major differences might emerge between the holdings of SPYG and QQQ, since QQQ has the limitation of having to own only stocks listed on the Nasdaq exchange. So I listed all the stocks in QQQ and SPYG and then did a spreadsheet search to find out which stocks that appeared in one of the ETFs was not found in the other.
Half of the 102 stocks currently held in QQQ, which make up 23% of its value by weight, were not found in SPYG, which, since their market caps were large enough to qualify for SPYG, suggests that they would not pass SPYG’s growth screens.
One hundred and ninety stocks of the 240 stocks in SPYG which make up 37% of the value of SPYG by weight, are not held in QQQ. Some aren’t in QQQ because their market caps would be too small to make it into the top 100 stocks listed on the Nasdaq. But when we look at the companies with larger market caps, we see quite a few large cap growth companies held by SPYG are ones that aren’t listed on the Nasdaq exchange and thus aren’t candidates for inclusion in QQQ.
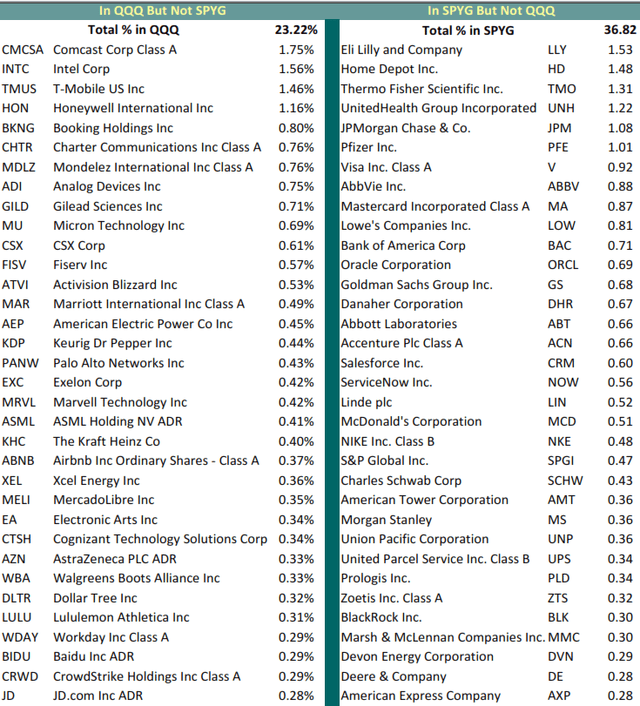
Below you see a table of the stocks making up at least 0.28% of the total value of one ETF that are missing from the holdings of the other. I cut of the comparison at this holding weight as a longer list would be too unwieldy to display.
Stocks Held Only By SPYG or QQQ But Not By Both
SSGA.com, Invesco.com, table created by the author
When I considered all of the 99 stocks that are missing from QQQ but found in SPYG, I saw that most are held in very small quantities, and each make up less than 0.10% of the total value of SPYG. That makes sense as SPYG holds almost two and a half times as many stocks as QQQ. But we can pretty much ignore stocks that make up such a small part of SPYG by weight, as even dramatic growth in their market caps wouldn’t make much of a difference in the performance of SPYG.
QQQ Excludes Financial Stocks Found in SPYG
Looking at the two lists of the stocks held in larger quantities, displayed above, one obvious difference emerges. QQQ’s index explicitly excludes Financial Sector stocks, while SPYG includes them. So several of the larger stocks missing from QQQ are Financials, including JP Morgan Chase (JPM), Visa (V) and Mastercard (MA), Bank of America (BAC), and Goldman Sachs (GS).
Visa with a forecasted future earnings growth rate of 18.66% and Mastercard with a forecasted future earnings growth rate of 22.70% look like growth stocks I would be happy to own.
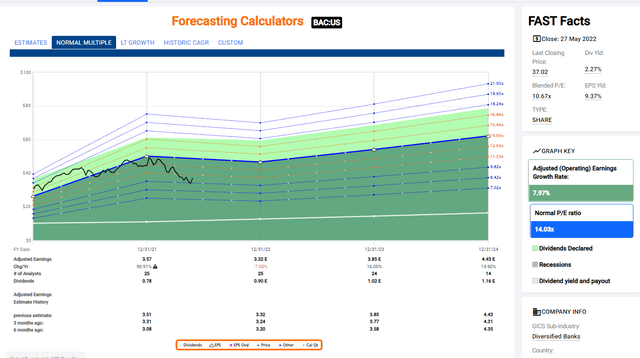
Bank of America is expected to grow its earnings by an annualized rate of 7.97% going forward, not particularly growthy. In fact, looking at how it’s P/E ratio currently appears using Fastgraph’s Forcasting Calculator it looks to me more like a Value stock.
BAC Looks like a Value Stock on Fastgraphs’s Forecast Calculator
fastgraphs.com
JP Morgan Chase’s earnings are expected to decline by an annualized rate of 1.33%. Goldman Sachs is even worse. It is predicted to see its earnings decline by an annualized rate of 3.49% over the next couple years.
I have to wonder whether JP Morgan Chase and Goldman Sachs will be removed from the S&P 500 Growth index the next time it is recalculated in December of 2022.
There are More Tech and Communication Services Stocks in QQQ than SPYG and Less Health Care
Several of the stocks QQQ holds in significant quantities that don’t appear in SPYG are Tech stocks and Communications Services stocks. Intel (INTC), Analog Devices (ADI) and Micron Technology (MU), stand out from the Tech sector, as do Communications sector stocks Comcast (CMSCA), T-Mobile (TMUS) and Charter Communications (CHTR). But the rest of the stocks that don’t overlap are drawn from disparate sectors, including health care, utilities, and communication services.
Health Care plays a large role in the stocks included in SPYG that are missing from QQQ, with Thermo Fisher Scientific (TMO), Pfizer (PFE), United Health Group (UNH), and Abbvie (ABBV) standing out.
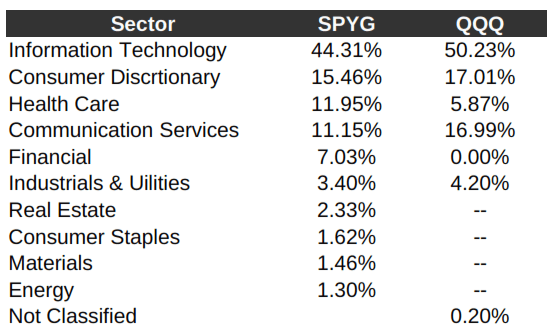
How QQQ and SPYG Sector Allocations Compare Overall
The heavier focus on Tech and Communications sector stocks in QQQ and the heavier weight given to Health Care and Financial stocks pervades through all the holdings of these two ETFs.
Below you can see the total allocation by sector for each ETF as reported by the ETFs providers. Tech and Communications sector stocks make up 11.96% more of QQQ’s total value than they do of SPYG’s. SPYG has a similar overweight in Health Care and Financials.
SPYG and QQQ Sectors By Weight
ssga.com and invesco.com, table by the Author
It Isn’t Possible to Do a Meaningful Comparison of Valuation with Supplied Metrics
It is tricky to compare valuation as ETF providers don’t report the same information and it is often difficult to know how they are calculating valuation metrics for the entire ETF. We are told that the metrics from SPYG are weighted harmonic averages, which is a common way fund companies calculate ratios for ETFs holding a lot of securities in different weights. We aren’t told how the metrics for QQQ as a whole are calculated.
The State Street Global Advisor metrics for SPYG are as of May 27, 2022. Those given on the Invesco QQQ product page are as of March 31, 2022. A lot has happened since then. Below you can see how their metrics compare, but given the huge time gap between the two datasets provided, the lack of comparative metrics, and the unknown way that QQQ calculates its metrics this is not very informative.
| SPYG (5/27) | QQQ (3/31) | |
| P/E Now | 23.51 | 28.00 |
| P/E Forward | 22.31 | 25.47 |
| Price/Book | 7.00 | 7.89 |
| Price/Cash Flow | 19.00 | Not Given |
| 3-5 Yr EPS Growth | 14.64 | Not Given |
| Return on Equity | Not Given | 44.80% |
Which Sectors Will the Rewarding Growth Stocks of the Future Come From?
The heavier concentration on Tech sector stocks and on the Communication Services stocks that used to be Tech sector stocks like Alphabet and Facebook have served investors in QQQ well until now. But it is quite possible that the advances that will make for the blockbusters of the next decade or two will come from other sectors: Health Care, Consumer Discretionary, and even, perhaps Financials, given the revolutionary changes being brought about by the radical new ways to conceptualize currency that are emerging, led by but not limited to, Crypto.
The flexibility of SPYG, which is not limited to holding stocks listed on any particular exchange could make it outperform going forward. Its emphasis on profitability may also protect it from the worst kinds of price deterioration we see in the kinds of momentum-driven profitless stocks that have robbed investors in the Ark Innovation ETF (ARKK) of 60% of the value of their investment in a single year. But by the same token, SPYG won’t profit from the momentum that drives up the value of unprofitable stocks when the market is overcome by investor euphoria.
Bottom Line: When it is Time To Invest in Growth, SPYG Is A Reasonable Alternative to QQQ
The dominance of the Big 4 mega cap stocks in both SPYG and QQQ make me disinclined to invest in either ETF until the valuations of those companies come down further. But when they do, I would be most likely to put my growth ETF money into SPYG.
SPYG has shown itself to perform slightly better during a period when markets are recovering from overvaluation. I also think it possible that it will benefit from changes in the business models of established companies, long listed on the NYSE that will capitalize on the innovations that some of QQQ’s companies have pioneered. The big auto manufacturers who are moving into the EV space are one example.
The superb past performance of QQQ is not due to the design of its index, and since it is an index fund bound only to select nonfinancial stocks listed on the Nasdaq exchange there is no guarantee that QQQ will continue to be overweight in the innovative, spectacularly growing stocks it held through the computer revolution. SPYG’s flexibility allows it to hold the best of the future’s profitable growth stocks no matter where they are listed or in what industry they are found.
[ad_2]
Source links Google News

