[ad_1]
peshkov/iStock via Getty Images
As an active investor and financial author, I relish my time spent researching financial investment opportunities. Occasionally, I uncover ideas which just make good investment sense, and so is the case of First Trust Advisors Capital Strength ETF (NASDAQ:FTCS). The investment strategy is based on focusing portfolio selections centered on sound financials and strength in the balance sheets. From this strength comes a portfolio of 50 stocks which excel in three basic financial criteria. The downside to FTCS seems to be the strategy is much like a technical focused ETF where the individual company, its business, and earnings performance are not considered in the selection process. I am somewhat surprised with the lack of coverage on Seeking Alpha since its last commentary was in 2015. I do not plan on waiting 7 years for my next update of this unique strategy.
Overview and Process
First Trust Advisors Capital Strength follows the Capital Strength Index (NQCAPST), a unique index of companies with strong financial profiles. The Index is developed, maintained, and sponsored by The NASDAQ OMX Group. The Index pool begins with the top 500 largest companies as determined by their float-adjusted market capitalization. From these 500 companies, the Capital Strength Index develops a portfolio which combines three basic financial attributes:
- Companies with more than $1 billion in cash and short-term investments and
- Companies with long-term debt divided by market capitalization of 30% and less and
- Companies with return on equity 15% and greater.
From this list, the Index then screens each company’s stock performance based on a combination of recent 3-month (annualized) and 12-month volatility. Typically, a security’s standard deviation of returns is used to measure whether a security has high or low volatility. The goal of this screen is to include stocks with low standard deviations which implies lower volatility and more stable share prices.
From these four qualities, the sponsor identifies the top 50 stocks which then comprise the Index. First Trust Advisors Capital Strength ETF portfolio will adjust and equal weight these top 50 stocks every quarter.
NASDAQ, the Index provider, issued an 11-page in-depth report in 2021, titled Winning on a Foundation of Capital Strength, on the investment strategy, methodology, and performance of the Index. While a bit lengthy, the following excerpt from the NASDAQ research report is a great overview of both the investment strategy and the reasoning behind the Capital Strength Index:
“Offense sells tickets, defense wins games, rebounding wins championships.” – Pat Summitt
What makes The Capital Strength Index (NQCAPST) unique to other indexes, particularly those that are multi-factor based, is that it sits in the middle of the offensive and defensive equity spectrum. In essence, it meets all three of the late Pat Summitt’s variables in her famous quote, “Offense sells tickets, defense wins games, rebounding wins championships.”
The index methodology that NQCAPST employs is not limited to any single style, such as value or growth, so it has the capacity to allocate to growth, a traditional offensive style, so long as the components meet the selection criteria, which is based on profitability, leverage, and cash reserves. Second, the index has many defensive qualities namely, the fact that it incorporates a low volatility screen. The premise behind this feature is that the index has the potential to deliver less volatility and smaller drawdowns than the market and other traditional equity indexes. Finally, as Pat Summitt stated, “rebounding wins championships.” Many defensive equity strategies may provide insulation from market turbulence, but can they “rebound” after a market correction? Can they keep up and outperform the market? Through the combination of quality and low volatility screens, NQCAPST has proven that it can rebound and participate to the upside.
An interesting aspect of First Trust Advisors Capital Strength ETF portfolio is the high turnover generated by these specific four criteria. With a constituency review every 3 months, combined with a somewhat limiting concentration of a 50-stock portfolio, Morningstar lists FTCS as having a 112% annual turnover ratio for the past year, which some could consider as high.
First Trust Advisors Capital Strength ETF has accumulated $8.2 billion in assets, which should be considered in the top 100 of US Equity ETFs in asset accumulation, per data from etfdb.com. FTCS is sandwiched between VanEck Semiconductor ETF (SMH) and Vanguard Energy ETF (VDE) for AUM size. FTCS charges a 0.54% management fee. According to etf.com, there are 1,644 US equity ETFs with an average AUM of $3.0 billion and an average fee of 0.53%.
Performance
From the ETF’s inception in 2006 to June 4, 2013, First Trust Advisors Capital Strength followed a different index. The portfolio was previously based on an equal weighting of the Credit Suisse U.S. Value Index. On June 6, 2013, the ETF changed its index and strategy to the Capital Strength Index and is the only ETF to utilize this specific index. I think it is prudent to use the June 2013 as the due diligence date of inception as previous comparisons are based on a different strategy. Below are two performance graphs using several comparable benchmarks. The first is a dividendchannel.com chart comparing FTCS and the Equal Weight S&P 500 ETF (RSP) from June 2013 to present. It appears FTCS rebounds faster after a market correction than RSP, and I find this chart to be the most impressive. The second chart is provided by Morningstar and is from May 2012 to present. The index in the M* chart is the M* US Large-Mid Cap Total Return Index and the category is the M* Large Blend Total Return. Reviewing the M* chart, performance from the chart’s start date to the June 2013 index change for all three comparisons was very close, and the outperformance over the Large Cap Blend category really took root in the 2013 Index change.
dividendchannel.com Morningstar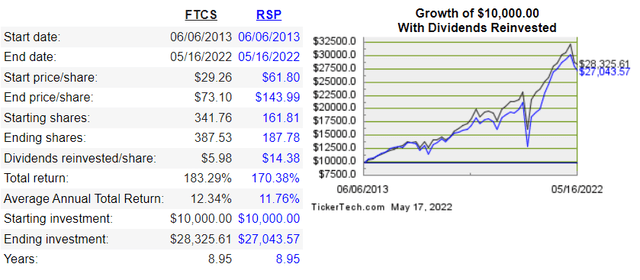
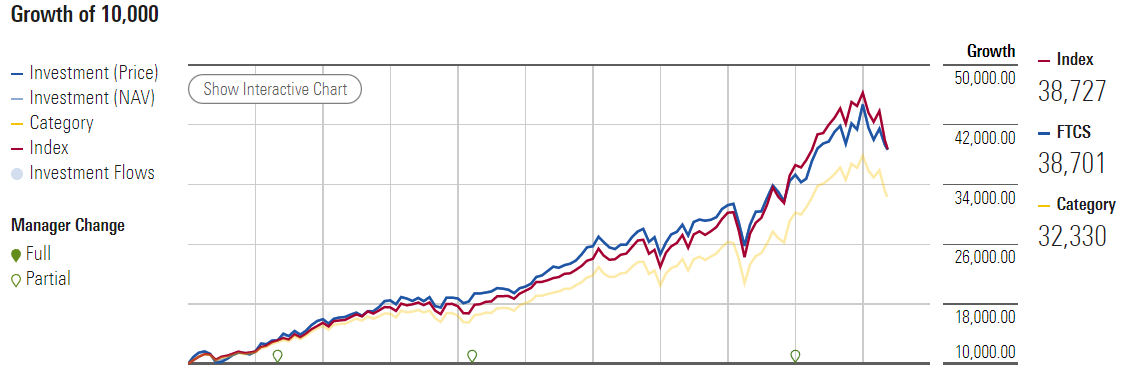
Drawdown
An interesting part of the NASDAQ research report is a listing of First Trust Advisors Capital Strength’s index performance during times of market weakness. A recap of the report’s conclusions:
In nearly all the -10% corrections since October 2006, NQCAPST [FTCS’ index] experienced a lower modified downside capture than the market when looking at peak to trough benchmark index data. This lower downside capture means that NQCAPST did not fall as far as the benchmark, providing downside protection during periods of weakness in the equity market. For this reason, it is possible to categorize NQCAPST as a defensive form of equity exposure.
As offered in the 2021 report, the list below are of times of market weakness since the index change in 2013. While the original published table begins in 2006, and is so indicated in the table heading, our interest remains post 2013. As shown, except for the most recent decline in 2020, FTCS performed better than the S&P 500 in down markets, as reported in the downside capture calculation. Of the 9 market declines of greater than -10% since 2013, FTCS declined an average of 91% of the market decline, giving this ETF a 9% advantage during market turmoil.
Winning on a Foundation of Capital Strength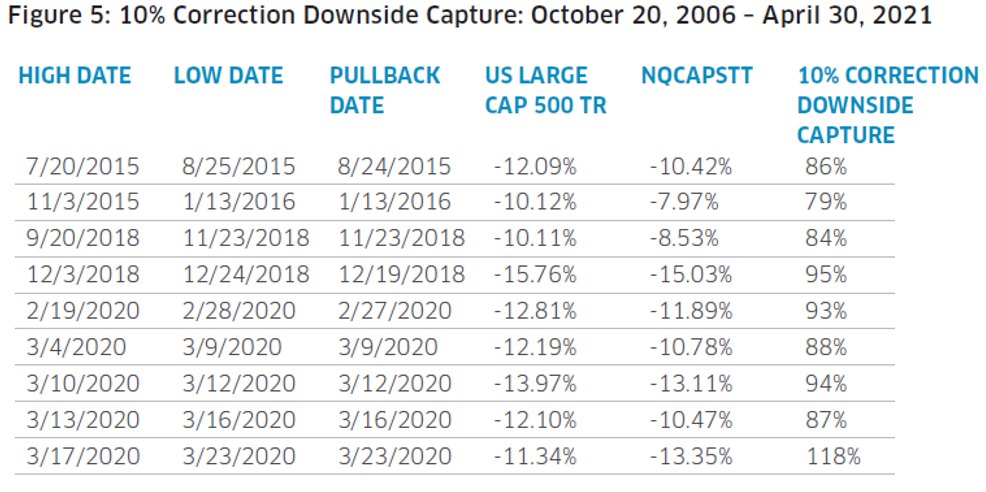
Current Portfolio and Portfolio Changes
As an equal weighted ETF, the percentage of each holding is relatively unimportant as the current position weighting varies from 2.44% to 1.70%. The list below is the latest portfolio holdings, as of May 14:
Morningstar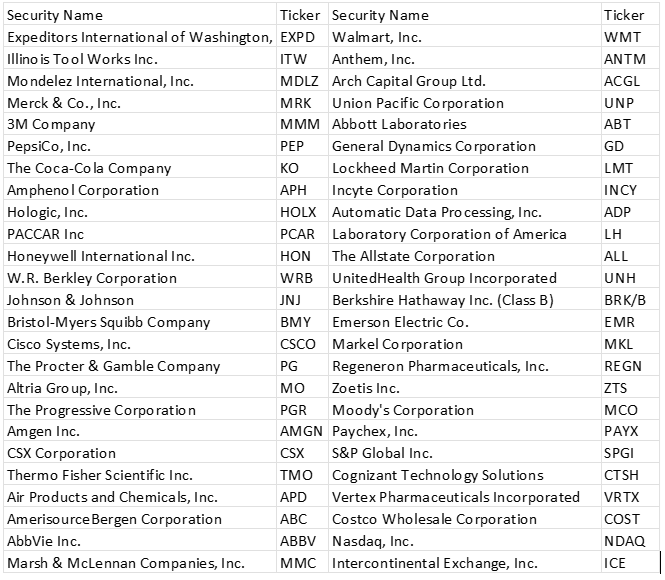
The latest rebalance after the first quarter 2022 provides additional insight into the workings of the strategy. Out of the original stock universe of 500 companies, 66% of the companies passed “cash test” and 5 then-current holdings failed the test. Of the 331 remaining stocks, 75% passed the “debt test” and 3 holdings failed. Of the remaining 247 stocks, 61% passed the ROE “profitability test” and 2 holdings failed. Of the remaining 151 stocks, 50 stocks pass the “volatility test” and 10 holdings failed. In this quarterly rebalance, 30 stocks remained in the portfolio and 20 were replaced.
First Trust Advisors Capital Strength ETF portfolio offers an interesting sector allocation, as described below from Morningstar, as of May 16:
Morningstar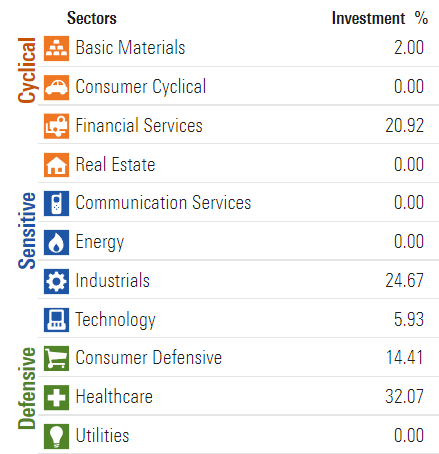
Five out of the 11 sectors have no representation in the current portfolio, with Healthcare, Industrials and Financials comprising 78% of the portfolio.
Summary
For investors looking for a “process investment strategy” over a “position investment strategy”, e.g., the Capital Strength Index selection process vs owning all stocks in a specific sector or market cap, First Trust Advisors Capital Strength ETF is very worthy of review. FTCS offers significantly overweighting of stocks with low volatility and a strong financial foundation, two factors critical to maintaining stock value during times of market disruptions.
I bought a starter position in FTCS in September 2020 and have added twice since. First Trust Advisors Capital Strength ETF was recommended in the October 2020 issue of Guiding Mast Investment as the monthly offering of “Under the Radar Screen” stock selections. Overall, FTCS performance has been to my liking and fits well in my investment bucket titled “equities bought primarily for long-term capital gains” as a more conservative and diversifying selection. I anticipate increasing my position in FCTS over the next several quarters as the market continues its twist and turns southward.
[ad_2]
Source links Google News

