[ad_1]

Nastassia Samal/iStock via Getty Images
Vanguard Total Stock Market ETF (NYSEARCA:VTI) is the ETF version of the fund preferred by Vanguard founder John Bogle as the US Equity portion of his personal portfolio. His often stated reason was that while different cap sizes might do better at different times it was hard to predict in advance which would lead. His solution was simple: own an index that represents literally everything: all companies in the US market. VTI is designed to represent all the stocks in the large cap S&P 500 (VOO) plus the smaller mid caps, small caps, and micro caps which the S&P 500 does not include. That’s the most important fact to know about VTI.
Despite being a great admirer of Bogle, Warren Buffett feels that the S&P 500 is diversified enough and chose it for the trust set aside for his wife. His underlying reason may to be that the larger companies in the S&P 500 are proven successes and the smaller companies which succeed and grow will eventually join the S&P 500 as their market cap rises. The cap weighted character of both VTI and the S&P 500 have the helpful feature that as a stock’s market cap rises it becomes a larger part of the index. There is another minor detail which is rarely mentioned. Trading costs for much smaller companies are higher because they shift around in value just like large cap companies but there are more of them. As a result the methodology of VTI differs from that of the Large Cap ETF representing the 500.
The Vanguard Large Cap ETF uses a “full replication technique,” meaning that it actually includes each stock in its exact market weighting. As stated in SA’s Fund Profile the Vanguard Total Stock Market Index ETF (VTI) – the one we are concerned with here – “holds a broadly diversified collection of securities that, in the aggregate, approximates the full index in terms of key characteristics.” The reason is almost certainly the fact that the Total Stock Market Index contains 4124 stocks, about eight times the number in the S&P 500. Many of the stocks in the index have very small market caps and may trade erratically, but nevertheless need to be represented. The trading costs of the “full replication technique” would be large for the mid, small, and micro caps. Thus the approach of “aggregation” and “approximation. Should investors be okay with that? In practical terms, yes.
On the face of it a well constructed aggregation approach is probably close enough, but it is certainly not made up of all US stocks as Bogle seemed to think. A little bit of statistical manipulation may be worth it in order to represent all market cap levels. I got an interesting insight this morning, however, in the way small errors may add up. I always put things in our microwave oven with the handle pointed straight out. I know that in a period measured in even minutes the handle always ends up back in the same position. Except that it doesn’t. It works pretty well for 1, 2, or 3 minutes but as the number of minutes adds up the handle ends up farther and farther away so that I sometimes have to reach for it awkwardly. What I suddenly realized this morning was that my original placement wasn’t exact and the error increased with every additional minute. Pretty soon it was pointing in the opposite direction. That was awkward if I was holding a cup of coffee in my other hand. Does this make me worry about error accumulation in VTI? Not much, to be honest, just an amusing thought. Your decision as to whether you choose to buy VTI will likely be based on other factors.
How Are VTI and VTV Different?
The major point in this article does not consist of the minor differences between two similar index ETFs but between VTI, which includes the total US market (approximately) and VTV, the Vanguard Value Index ETF (NYSEARCA:VTV), which includes only the part of the S&P 500 classified as “value.” That’s a very major difference, and unlike other articles I have written which have looked at ETFs with very similar holdings, this article looks at ETFs which present a stark contrast. The differences between VTI and VTF involve important questions of investment philosophy. They make you think hard about market trends. Your decision requires an assessment of where the market may be now in the long cycles which have historically taken place between “value” and “growth.” That is necessary in order to understand whether it is worth it to make a heavy bet on “value.” Or would you, like John Bogle, prefer to stick to an ETF which owns the entire US market, more or less? The criteria start with who you are as an investor:
- Investors who don’t follow the market closely and have a very long term time horizon might prefer VTI. It does all the work for you and assures that you get the market return with low expenses.
- Investors who do follow the markets closely may feel that the current “value” phase is likely to persist for a while. Or they may have a long term philosophical preference for value. They must be willing to accept the risk that comes with owning a portion of the market as opposed to all of it. These investors might prefer VTV, which also like all Vanguard index ETFs has low expenses.
What Exactly Do We Mean When We Use The Term “Value”?
As I said in an earlier article about growth, “value” is often defined using the Potter Stewart principle. Supreme Court Justice Potter Stewart famously said of pornography, “I know it when I see it.” The thing is, it is not hard to look at a long term chart of Apple (AAPL). Microsoft (MSFT), and Amazon (AMZN) and say, Hey, Apple, Microsoft, and Amazon are growth stocks, I can see that plainly. Their operating numbers confirm it. “Growth” is also strongly suggested by those four letter ticker symbols which mark them as NASDAQ stocks. Identifying value isn’t quite so simple.
Over the decade from 2010 to 2020 you could find the leading growth stocks just by glancing at the Top Ten stocks by market cap in all of the major large cap indexes. In other words, we may not know what “value” is, but we probably know, or think we know, what value isn’t, although in recent years some well-known value-oriented fund managers have constructed a model of their own which manages to define growth stocks like the ones above as value stocks. This has enabled them to sneak these growth companies into their portfolios. The VTV value approach involves a methodology designed to replace that idiosyncratic method.
About a decade ago I stumbled upon the fact that Vanguard had begun to cite an unfamiliar model for some of its large cap funds. The new model was derived from the CRSP Indexes (Center For Research In Security Prices) developed by the University of Chicago Booth School Of Business. The Booth School approach is world famous for its quantitative approach to business and the markets. It has six factors defining growth – both long term and short term future EPS growth, three year historical growth in sales and earnings, the ratio of investment to assets, and return on assets. The CRSP methodology for defining growth has nothing to say on the subject of price or valuation. The estimates for both long and short term future growth are sourced from I/B/E/S (Institutional Brokers’ Estimate System) which derives data from over 18,000 analysts. In other words, CRSP sees growth as being all about the imperfectly knowable future.
The Value model is very different as price and valuation are involved in all five criteria. Only one criterion involves the future, a three year forward look at earnings. A three year projection shouldn’t make anybody nervous, because many analysts make estimates like that. CRSP nevertheless uses the same Institutional Brokers’ Estimate System. Note that the terminology reverses common practice (Price-to-Book Value, for example, become Book Value To Price, making both comparable to Dividend Yield.)
VALUE FACTORS USED IN MULTI-FACTORS MODEL
- Book to Price
- Future Earnings to Price (3 years)
- Historical Earnings to Price (3 years)
- Dividends to Price
- Sales to Price
As opposed to the Growth Model, everything in the Value Model is a ratio involving Price. All stocks in every size category except micro caps are put through quantitative analysis in both Growth and Factor models and assigned a composite number before being placed in the Growth or Value category and occasionally split between the two. They are then ranked by market cap the same way stocks are ranked in other cap-weighted indexes. With CRSP, however, there are two major differences:
- Rebalances are done on a quarterly basis rather than daily except for events like mergers, acquisitions, etc. Stocks with market caps near the boundary of a market cap category are kept in a border area from which they may “migrate” at the end of quarterly reset up to large cap, say, or down to mid-cap. They do this by a multi-step formula which may place them half in the large cap index and half in the mid cap index.
- Interestingly, the same approach is used for a stock which is a borderline case when it comes to Growth and Value. Not only can they “migrate” from Growth to Value, or vice versa, but at some points in this process they may be represented 50/50 in both indexes. You can compare indexes and check for this if willing to take the trouble. It’s the reason that the Vanguard Value ETF (VTV), though derived from the S&P 500 Index, contains 350 stocks compared the 268 stocks in the growth index. The index itself contains only 508 total so some stocks are partially represented in both indexes because they rank high in the criteria for both. There may be a future article about those stocks appear in both indexes because some of them might be real gems.
The above look at the construction and workings of CRSP Indexes shows the level of seriousness Vanguard brings to the concepts of growth and value. In effect it builds an Index from the ground up with quantitative rigor. There is a clear logic behind the value factors. Value investors look for stability, low price, moderate growth, and dividends. Those are the things the five factors select for, and many suggestions for dividend investment on this site make the case in pretty much the same terms. The Top Ten holdings of VTI and VTV provide a concrete example of the kind of stocks the system produces.
Deconstructing The Top Ten Holdings Of VTI and VTV
The table below presents the Top Ten holdings of VTI and VVTV as of March 31, 2022. They share three stocks.
| As of March 31, 2022 | Vanguard Total Stock Market ETF (VTI) | Vanguard Value ETF (VTV) |
| 1 | Apple Inc. | Berkshire Hathaway Inc. |
| 2 | Microsoft Corp. | UnitedHealth Group Inc. |
| 3 | Alphabet Inc. | Johnson & Johnson |
| 4 | Amazon | JPMorgan Chase & Co. |
| 5 | Tesla Inc. | Procter & Gamble Co. |
| 6 | NVIDIA Corp. | Exxon Mobil Corp. |
| 7 | Berkshire Hathaway Inc. | Chevron Corp. |
| 8 | Meta Platforms Inc. | Pfizer Inc. |
| 9 | UnitedHealth Group Inc. | AbbVie Inc. |
| 10 | Johnson & Johnson | Bank of America Corp. |
| % of total net assets | 25.60% | 21.10% |
What one notices immediately is that the number one ranked VTV value stock by market cap, Berkshire Hathaway (BRK.A)(BRK.B), is ranked #7 on the list of the Total Stock Market ETF. What this means is that the famous growth stocks are ranked ahead of Berkshire in the VTI ETF. What makes it particularly interesting is that these market leaders are currently leading the market as a whole to the downside as the market slides from a correction toward a full fledged bear market. In choosing between the two indexes, this fact should be filed away as an important consideration. Leading tech growth stocks have spent the past ten years advancing to the top of the list. Should an investor stick with them or look elsewhere?
Key Metrics For VTI And VTV
The tables below provide a concrete sense of the total market index as opposed to the large cap value index.
| Equity characteristics | ||
| As Of March 31 | Vanguard Total Stock Market ETF | Vanguard Value ETF |
|---|---|---|
| Number of stocks | 4124 | 350 |
| Median market cap | $133.8 billion | $119.6 billion |
| Price/earnings ratio | 21.2x | 16.3x |
| Price/book ratio | 3.9x | 2.7x |
| Return on equity | 19.6% | 14.6% |
| Earnings growth rate | 20.6% | 12.5% |
| Turnover rate | 4.0% | 8.9% |
The numbers above clearly accord with value factors in the CRSP Multi-Factor model. VTI, which includes growth stocks, dominates the factors unrelated to price. It leads in return on equity, 19.6% to 14.6%, and earnings growth, 20.6% to 12.5%. Value leads in statistics anchored in price and valuation, with a lower ratio of price to book value, 2.7x to 3.9x and price to earnings, 16.3% to 21.2%. The numbers for both funds look exactly as one might have expected. It’s important to remember that the Total Market ETF contains value growth mixed in with growth stocks. Otherwise the difference in each of the four major statistics would have been quite a bit greater.
| Equity sector diversification | ||
| As Of March 31 | Vanguard Total Stock Market ETF | Vanguard Value ETF |
|---|---|---|
| Basic materials | 2.54% | 2.99% |
| Communication services | 8.62% | 4.19% |
| Consumer cyclical | 11.65% | 2.75% |
| Consumer defensive | 6.01% | 10.93% |
| Energy | 3.91% | 7.39% |
| Financial services | 13.21% | 21.02% |
| Health care | 13.52% | 20.64% |
| Industrials | 8.96% | 12.27% |
| Real estate | 3.77% | 3.48% |
| Technology | 25.15% | 8.71% |
| Utilities | 2.66% | 5.63% |
The difference in percentage represented by various market sectors is also unsurprising. The value index ETF owns much less technology, consumer cyclicals, and communication services and much more of consumer defensives (staples), energy, health care, industrials, and utilities. In summary, it is positioned much more defensively than the market as a whole.
ETF Grades And Quant Ratings
There are no Wall Street Analysts with ratings on VTI – not surprising because to rank VTI is essentially to make a call on the market. Seeking Alpha Authors are neutral with a negative bias with one Buy, two Holds, and two Sells. On VTV SA Authors have one Buy and two Holds, a bit more positive than on VTI. There are no Wall Street Analyst ratings on VTV.
The ETF Grades And Quant Ratings on VTI are positive with a C+ rating on Momentum but an A+ on Expenses and Risk. Dividends and Asset Flows both earn an A. Expenses are the usual minuscule Vanguard amount, 0.03%. Risk is essentially the same as market risk. The decline in Momentum stems from the recent decline in the market as a whole, which has the corollary effect of the Dividend yield rising. Asset Flows probably declined a bit as the market as a whole sank into a correction.
Quant Rankings on VTI:
Rank in Asset Class (US Equity) 211 out of 468
Rank in Sub Class (Large Blend) 72 out of 135
Rank Overall 888 out of 1998
The ETF Ratings on VTV share the A+ Expense Rating. Its Momentum is an A and Asset Flows at A- are consistent with the second of the charts to follow which show VTV doing better than the market for the past year.. Dividend yields have fallen as prices rose. The focus on a single market sector keeps its Risk Grade higher than that of VTI.
| Now | 3M ago | 6M ago | |
|---|---|---|---|
| Momentum | A | A | D+ |
| Expenses | A+ | A+ | A+ |
| Dividends |
A- |
A | A |
| Risk | A- | B | B+ |
| Asset Flows | A- | A- | A- |
Quant Rankings On VTV:
Rank in Asset Class (US Equity) 47 out of 471
Rank in Sub Class (Large Value) 31 out of 189
Rank Overall 195 out of 1992
The Overall Quant Rating on VTI is Hold although its Quant forecast is that VTI will beat the market. The Overall Quant Rating on VTV is a Strong Buy and the Quant forecast is also that it should beat the market.
Charts Show Market Performance Shifting Toward Value
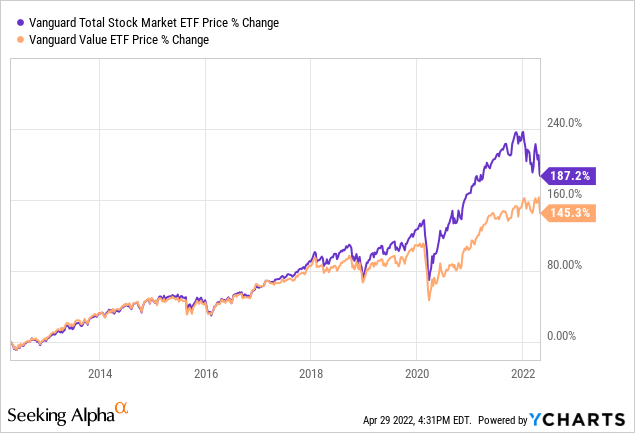
The first chart describes a period when the overall market was much stronger than large cap value index, 2012 to the present. However, if a large cap value fund or ETF had existed as early as 2000, its chart would have shown major outperformance by large cap value from 2000 through 2009. Although it is a small sample, this makes the argument that value and growth take turns outperforming over cycles as long as a decade. The reason no Vanguard large cap value index funds existed in 2000 was that investors were largely caught up in the dot.com bubble of the late 1990s. Very few investors had any interest in value. When the dot.coms and other growth leaders finally started to crash in March 2000, investors began to think that value might be a good idea after all. Vanguard issued value funds and value led until 2012. VTI, led by the growth stocks in the above section, began to take the lead again in 2014.

As of the present moment, holders of the more inclusive ETF must be pleased with the results. The question is whether this is a very long term trend. That question is particularly important as a shorter term chart shows evidence of a potential trend change in the direction of value.

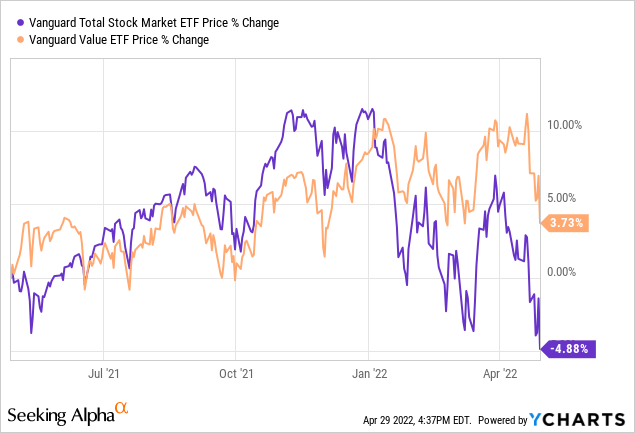
What you see in the one-year chart is the evidence that the Total Stock Market ETF began to roll over in November 2021 and fell much harder than the Value ETF in a trend change which has picked up momentum since the beginning of 2022. The question an investor must ask is whether this is a temporary blip or a major longer term change of trend like the one which gave value investors a place to hide in 2000 as the dot-com growth leaders crashed. Will that history repeat? To answer that question readers will have to call up all their past experiences in the market. To consider betting heavily on one side of the market requires experience and willingness to accept sector risk.
Is VTI Or VTV The Better Buy?
It depends. Some guidelines were already mentioned in the introduction. Here are some things to bear in mind:
- Both VTI and VTV are excellent ETFs for long term investors. Both have minuscule expenses. Investors who do not follow the market closely should probably hold the Vanguard Total Stock Market Index especially if young and able to invest regularly for several decades. This very general suggestion is based on the same reasoning used by many retirement plans which include fund or ETF offerings based on the total market index. The idea is to stick to the whole market through its ups and downs despite the fact that market leadership changes from time to time. The legendary John Bogle, who introduced the index fund and founded Vanguard, prefers this approach.
- Savvy and experienced investors with tolerance for risk might chose VTV if they made the assumption that the market has pivoted to value for several years. At some point in the future they could rebalance toward growth by buying a growth index ETF with new money. This is not a recommendation for all investors but notes the apparent shift toward value which was out of favor for a while and in the current market decline has so far provided some defense.
Studies based on valuation suggest to many observers that returns for equities, regardless of how they are sliced and diced, are likely to be below normal for the next decade. The above charts show a market which is currently trending down. There is also evidence in the short term charts comparing growth and value that after a decade of growth dominance value may be entering a significant period of leadership. Value might do better over a period of poor overall market returns, helped in part by higher dividends.
These hints of overall market behavior and future leadership of value may or may not come to pass. The conventional wisdom argues that efforts to time the market have not succeeded for most investors. Buying an instrument like VTI at regular intervals is a good idea at most times, particularly when buying regularly in a 401K account and especially for investors who don’t follow the market and watch their investments closely. Investing similar amounts regularly over a period of time accumulates more shares when the market is down and lowers average cost. If you are young enough to have a long investment horizon, this may be the way to go.
There are many arguments and counterarguments. There’s no easy and guaranteed answer when it comes to choosing between VTI and VTV. If I made a strong recommendation it would be one person’s opinion rendered in an area of some uncertainty. As with most investment choices you yourself are the ultimate factor. Your choice will be heavily dependent on your knowledge of market history, your own goals, your best estimate of the economic environment and future, your time frame, and your risk tolerance.
[ad_2]
Source links Google News

