[ad_1]
franckreporter/iStock via Getty Images
Investment thesis and background
Since we launched our marketplace service recently, many readers and members have asked about the key differences between our portfolio strategy and the more “traditional” strategies like the 40-60 strategy. The reasons are multifold. For example, the 40-60 allocation does not make sense under the current market with low bond rates. Furthermore, the combination of traditional wisdom of a 4% or 5% withdrawal rate and a 60-40 portfolio has a good chance of running out of money if you are looking at a time frame of more than 20 years. These discussions are detailed in our blog article here if you are interested.
This article uses the iShares 20+ Year Treasury Bond ETF (TLT) to illustrate the above interest rate risks and our portfolio strategy. You will see that:
- We do not use these traditional templates because bonds won’t help as much now, or in the many years to come, as they did in the past.
- Particularly, long-term bond like TLT faces substantial interest rate risks. We see a good chance to long-term bond rates rise to 3.5%, i.e., about 1% above its current level. At a very fundamental level, in the long term, treasury bond rates cannot rise above long-term inflation or GDP growth. Our government has been relying on inflation and GDP expansion to inflate away and outgrowth its debt obligations for decades in the past. And it will (it will have to) continue doing so. However, you will see a 1% rise is already a large interest rate risk for long-term bonds like TLT.
- The 40-60 fixed allocation (or any fixed allocation) does not make intuitive sense to us. Fixed allocation strategies work most of the time, but misses extreme market opportunities – which matter the most.
TLT: interest rate risks
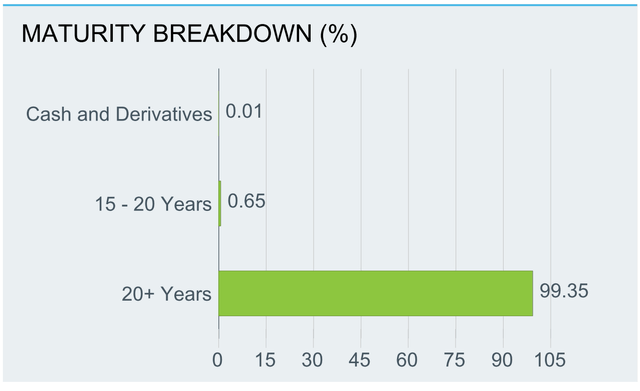
TLT is one of the popular iShares ETFs with a sizable AUM of $16B. It charges a reasonable fee of 0.15%. It trades with a decent daily volume and a very tight spread of 0.01%. It offers convenient exposure to long-term U.S. Treasury bonds. The detailed exposure of the TLT fund is shown below. As can be seen from this chart, the fund is exclusively exposed to one specific segment of the U.S. Treasury market – those with 20+ years of maturity, which leads us to the interest rate risks.
Source: iShares Fund description
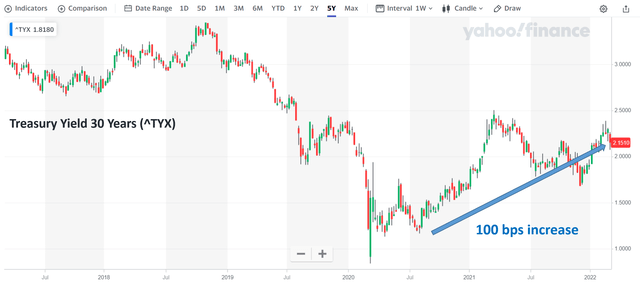
In the past decade (or decades if you further expand your horizon), treasury bonds have gone through a long-bull market with the yield dropping consistently and bottoming near 1.2% during the COVID outbreak. Now as you can see from the following chart, during the past few months, due to the concern Fed’s plan to increase interest rates, the long-term treasury bond yield has reversed its course. It now has surged by almost 100 basis points, from its historical low of about 1.2% to the current level of 2.2%. And next, we will see the effect of such an interest rate change on TLT.
Source: Yahoo Finance
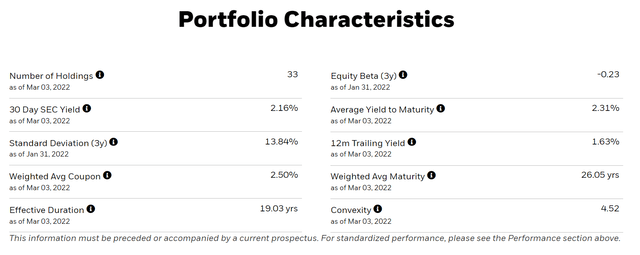
The average maturity for the TLT fund is 26.0 years as can be seen below. The price of a bond goes up when its yield goes down and vice versa. And a primary driving force for bond yield is the bond yield mentioned above. The average duration is a quick (but reasonably accurate) way of estimating the price change of a bond fund as a function of yield. When the yield rises by 1% (e.g., caused by a 1% interest rate hike and/or credit risk), the price of a bond decreases approximately by its effective duration in percentages. So in the example of TLT, its price will drop by about 26%.
Source: iShares Fund description
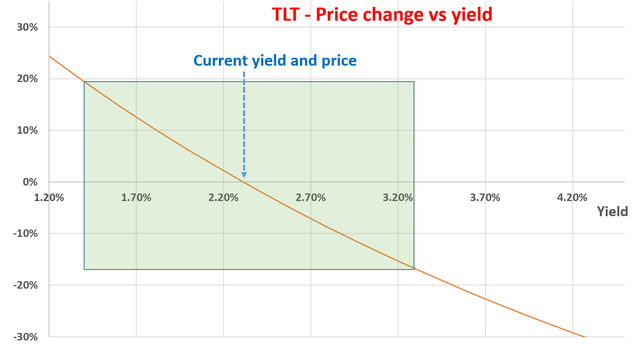
The next chart shows how exactly the price of TLT will change when the bond rates further change from the current level of 2.31%. As can be seen, when the yield changes by 1%, the price change changes by close to 20% (highlighted in the green box). And this result is pretty close to the estimation mentioned above using the effective duration. For a long bond fund like TLT, the sensitivity to interest rate change is pretty large.
Now looking forward, the green box highlights our outlook for the future. That is the range of yield we anticipate. Specifically:
- Fed’s hawkish narratives to increase rates could easily cause interest rates to rise another 1%, thus driving TLT yield to about 3.3%.
- When/if its yields do rise to 3.3%, TLT price would drop by about 18% as shown in the chart. Part of this drop will be compensated by the coupon payment (current at 2.5% a year and the coupon payments increase as yield increases). So in the end, there could be a substantial total loss.
- On the other hand, there is a small chance for its yield to drop back to the historical low near 1.5% again. If this happens, TLT investors would enjoy a price appreciation of about 20% plus all the coupon payments.
So overall, we see the risk/return profile as unfavorable under these current conditions.
Source: author
Final thoughts and our bond holdings
Due to the above unfavorable risk/return profile, we do not hold TLT. Furthermore, you can also see why we are not so comfortable with the “standard” 40-60 or 60-40 templates ourselves now. To summarize, the reasons are:
1. Bonds won’t help as much now as they did in the past
And they won’t help much in the many years to come if you share our outlook. Currently, bond yields are near a record low and there is not too much potential for yield to drop and price to appreciate.
2. The 40-60 fixed allocation (or any fixed allocation) does not make intuitive sense to us.
Fixed allocation strategies may work most of the time, but it misses dynamic allocation opportunities. As a recent example, during the 2020 March COVID crash, TLT yields dropped to a level as low as about 1.2%). Yet if you stick to a fixed allocation template, you would still be holding a good portion of bonds in your portfolio. We use a dynamic approach and sold pretty all of our bonds at that time.
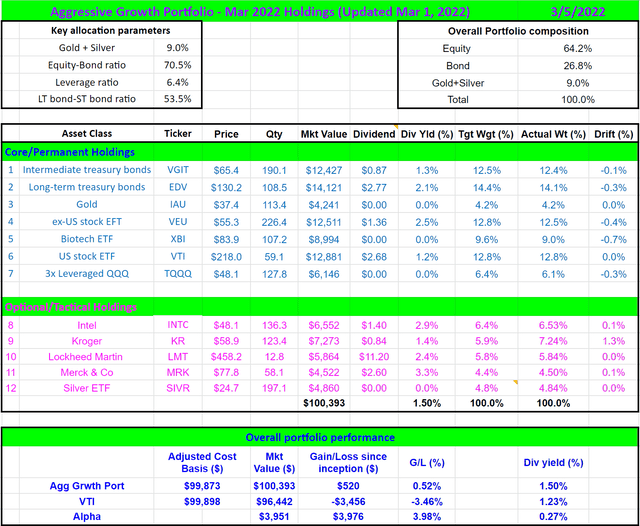
Instead of TLT, we have a small allocation of treasury bonds using the Vanguard Extended Duration Treasury ETF (EDV) and also the Vanguard Intermediate-Term Treasury Index Fund ETF Shares (VGIT). We favor EDV over TLT mostly because of the expense ratios (0.05% vs 0.15%). And as you can see, they have been very effective hedges against market turbulence that the market is going through. Since we launched this portfolio on Feb 1, 2022 (we have been holding this portfolio ourselves for years), the overall market lost about 3.5% since Feb 1, while our portfolio GAINED about 0.5% – amid the extreme market turbulence and a war! You can see the details of this portfolio further elaborated on in our recent blog article if you are interested.
Source: author
[ad_2]
Source links Google News

