[ad_1]
Funtap/iStock via Getty Images
Basic information
The Real Estate Select Sector SPDR ETF (NYSEARCA:XLRE) is a popular choice for investors seeking dividends and income from the domestic real estate sector. The fund offers a diversified, convenient, low-cost, and liquid approach for exposure to a wide spectrum of US real estate enterprises, ranging from office buildings, hotels, and shopping malls. The fund seeks to provide high current income and some growth potential. This post provides a closer look under the hood to better understand the approach, advantages, and limitations of XLRE. Based on such understanding, a few suggestions are provided for investors who want to fine tune their holdings to align with their risk tolerance and long-term investment goals.
It would help to briefly summarize my investment philosophy and writing interest to provide a context. I am a long-term and value-oriented investor. I hold a rather concentrated portfolio with about a few ETFs and some tactical stock holdings. And I like to write about them repeatedly and in-depth from different angles. Especially for REIT, I had spent a good part of my career in the housing market and am always looking for investment opportunities here.
Now back to XLRE, the following basic information is summarized for investors who are not familiar with this fund yet to facilitate the more in-depth discussion later.
* Number of stocks: 29 (all US stocks)
* Fund total net assets: $5.2 billion
* Expense ratio: 0.12%
* Current dividend yield: 2.43% (30 Day SEC Yield)
Note the 2.43% dividend yield. To put things in perspective, the current yield of the overall market (represented by the S&P 500) is about 1.34%, and that of the 10-year treasury bond is 1.9%. So XLRE provides almost a yield that is more than 80% than S&P 500 and almost 30% more than treasury bond. Although its current dividend yield is near a historical low as you can see from the chart below, indicating a relatively expensive valuation.
Source: Seeking Alpha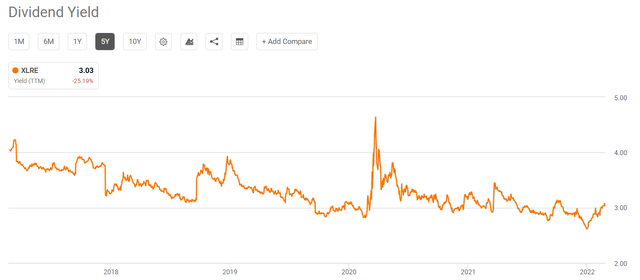
XLRE is indexed by market capitalization and therefore is top-heavy
The fund is indexed by market capitalization, and as a result, it is top-heavy. The top 10 holdings are listed below, and they represent more than 61% of the total net asset, almost 2/3. And the remainder of the 19 holdings makes up the rest 39% of the net asset.
There is nothing wrong with such a top-heavy index method. The S&P 500 itself is indexed by market capitalization and therefore is also top-heavy. It is all about your investment goals and risk tolerance. There are REIT funds more diversified than XLRE and less top-heavy in case you are more comfortable with those. For example, the Vanguard Real Estate ETF (VNQ) has 169 holdings and the top 10 holdings represent about 44% of the total asset (although the top 10 holdings are identical to those in the XLRE fund).
And if you really want to fine tune the holdings exactly to your own liking, you could build a portfolio yourself by selecting a combination of several ETFs or even individual stocks. At first glance, it seems like a ton of effort, but actually, it does not (or at least does not have to). And if you’re interested, you could see our previous post about the intricacies of diversification and see as few as a dozen well-selected stocks could do the trick.
Source: ETF.com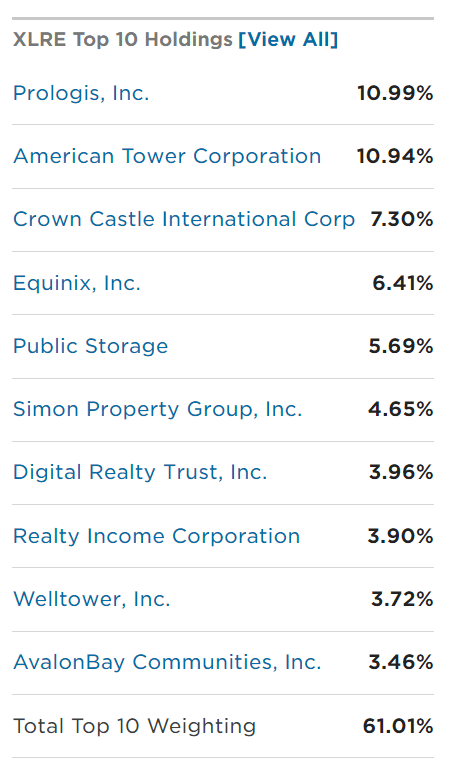
XLRE is very different from the overall market
The following chart compares the XLRE fund vs that of the overall market represented by the Vanguard S&P 500 ETF Fund (NYSEARCA:VOO). As can be seen, there are significant differences both in terms of valuation, ROE, and Vanguard’s forecasted growth. Note that P/E ratios are not directly comparable as REITs are more properly valued by their price to fund from operations. And the price-book value ratio of XLRE is about the same as the overall market. Despite all these differences, my evaluation is that both the REIT sector and the overall market are both quite expensively valued currently, as also indicated by the fact that its dividend yield is near a historical low as aforementioned.
Source: data from The Vanguard Group, Inc.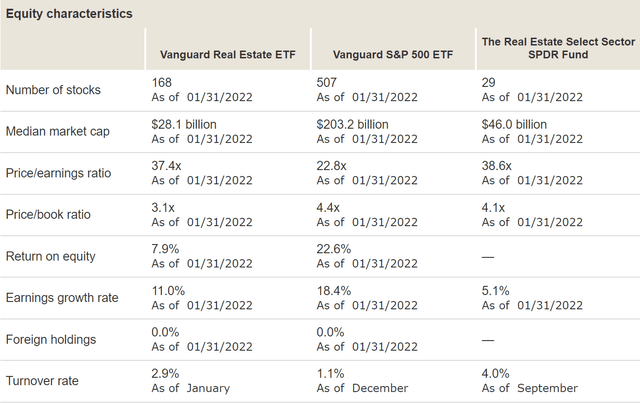
XLRE is not necessarily “safer”
Many people think that REITs are automatically safer as they are backed by real estate. Unfortunately, this is not necessarily true, or at least not entirely true depending on how you define safety. The next three charts further illustrate these subtleties by showing a comparison of the XLRE fund since its inception in 2016 against the overall market represented by VOO).
The first risk involves underperformance. As can be seen from the first chart, XLRE tracked VOO quite closely till ~2017, then began to significantly underperform after that. There are many reasons. For example, the COVID hitting the REITs sector harder than other sectors was a major one.
This chart also illustrates other risks. As seen, XLRE was actually equally risky or even riskier compared to the overall market in terms of the standard deviation, worst year performance, and the maximum drawdown.
Source: simulator from Portfolio Visualizer, Silicon Cloud Technologies LLC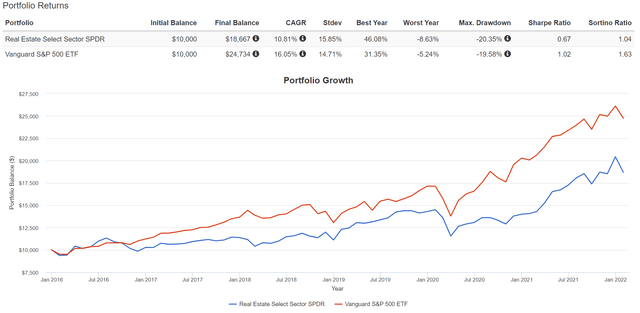
Lastly, as seen from the next chart, XLRE of course did what it’s supposed to do – delivering a high dividend yield. As can be seen from the chart, XLRE’s dividend income has been consistently and significantly higher than the overall market since its inception. So in some sense, XLRE provides some extra yield at the cost of performance and some degree of increased risk. A tradeoff that individual investors have to weigh considering their own goals and risk tolerance.
Source: simulator from Portfolio Visualizer, Silicon Cloud Technologies LLC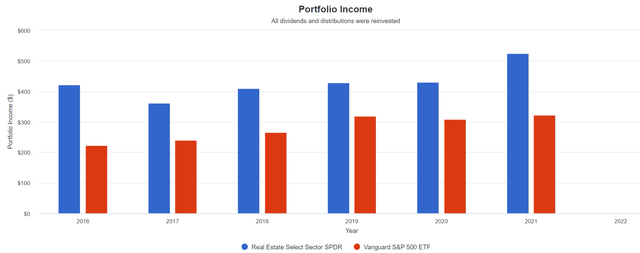
Possible approaches to fine tune XLRE
To recap, the under-the-hood examination above illustrates that there are both advantages and limitations of XLRE. The advantages included its convenience, low cost, liquidity, and high dividend yield. The limitations are its generically top-heavy indexing method, concentration risk (both sector and number of holdings), potential performance lag, and potential volatility which are on par with the overall market (or slightly larger).
With a good understanding of these limitations, there are several possible approaches that you could apply to fine tune the use of XLRE to better align with your risk tolerance and long-term investment goals. For example, you could use it in combination with other sector funds to bring its composition to be more aligned with the overall economy and be more diversified.
This next idea is also an idea that our family applies by holding XLRE together with other asset classes. What we did was to hold some long-term government bonds, such as the Vanguard intermediate Treasury Bond ETF (VGIT) and/or gold, to counterbalance some of the risks and volatility of the holdings in XLRE. The underlying idea is the so-called risk parity idea. More specifically, as you can see from the following chart, XLRE is closely correlated with the overall stock market but have a very low correlation with bond and gold. As a result, XLRE and bond tend to move in opposite directions, reducing the overall volatility.
Source: simulator from Portfolio Visualizer, Silicon Cloud Technologies LLC
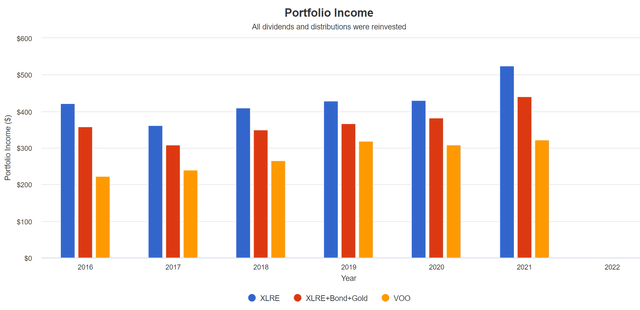
The next two charts illustrate this idea by a comparison of three portfolios: a portfolio holding XLRE only, a portfolio holding 80% XLRE + 10% VGIT + 10% gold with a quarterly rebalance, and a portfolio holding VOO only. As can be seen, the combined portfolio now delivered comparable return as XLRE most of the time, and only lagged XLRE by about 0.8% due to the recent bond market correction. But it substantially reduced its standard deviation, worst year performance, and maximum drawdown significantly – the metrics are comparable or even better than VOO now. And lastly, from the third chart in this section, you can see that the combined portfolio delivered slightly lower income compared to XLRE due to the zero yield from gold and low yield from VGIT in the past few years. With bond yields much higher now, this diversification strategy should work better going forward.
Source: simulator from Portfolio Visualizer, Silicon Cloud Technologies LLC Source: simulator from Portfolio Visualizer, Silicon Cloud Technologies LLC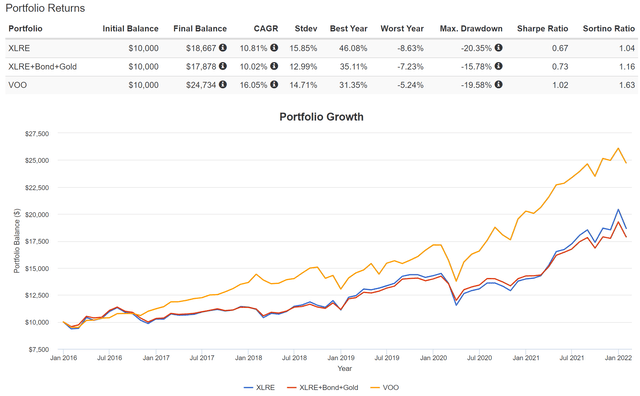
Conclusions and final thoughts
XLRE offers a diversified, convenient, low-cost, and liquid approach for exposure to a wide spectrum of US real estate enterprises, ranging from office buildings, hotels, and shopping malls. The fund seeks to provide high current income and some growth potential. Upon a closer look, the fund indeed delivered higher income and reasonable growth. The downsides include lower total return compared to the overall market and higher volatility due to its concentration risks.
Based on such understanding, a few suggestions are provided for investors who want to fine tune their holdings to align with their risk tolerance and long-term investment goals. For example, combined use with government bonds and gold can better hedge the risks, leading to reduced volatility while maintaining the same steady income stream and total returns as XLRE.
[ad_2]
Source links Google News

