[ad_1]

Ayman-Alakhras/iStock via Getty Images
Investment Thesis
With a trailing yield of 3.59%, the SPDR Portfolio S&P 500 High Dividend ETF (SPYD) is one of the highest-yielding dividend ETFs on the market today. It holds 80 securities selected from the S&P 500, has an expense ratio of just 0.07%, and its Index just reconstituted at the end of January. Many investors appreciate just how straightforward the strategy is and find it an easy and cost-efficient way of boosting their portfolios’ yield without taking on excessive risk.
I have reviewed SPYD and compared it with the many other dividend ETFs I track closely, and unfortunately, I find the fund lacking in several areas. First, its forward yield is only about 0.70% higher than a benchmark ETF I used that not only has stronger revenue and earnings growth rates, but a lower P/E ratio as well. Second, the fund has a lot of earnings risk at the moment, specifically among poor-performing Utilities stocks with 11 holdings yet to report this quarter. And finally, SPYD’s dividend growth rate is an issue. Its constituents have a lower five-year growth rate than my benchmark. Investors remain vulnerable to sudden spikes in outstanding shares, which I suspect is the reason for December’s minuscule distribution. While I believe value stocks will outperform growth stocks in the future, it’s not enough to offset these concerns, so, therefore, I am neutral on SPYD and rating it as a hold today.
SPYD Overview
Strategy and Fund Basics
SPYD passively tracks the S&P 500 High Dividend Index, which equally weights the 80 highest dividend-yielding companies in the S&P 500. The Index is rebalanced on the last business day of January and July using a reference date of the month prior, which means we have a brand new set of holdings to analyze today. Before we get to that, though, here are some of the fund’s key statistics to get us started.
- Current Price: $43.17
- Assets Under Management: $6.36 billion
- Shares Outstanding: 138.50 million
- Expense Ratio: 0.07%
- Launch Date: October 21, 2015
- Trailing Dividend Yield: 3.59%
- Three-Year Dividend CAGR: 1.46%
- Five-Year Dividend CAGR: 0.46%
- Dividend Payout Frequency: Quarterly
- Five-Year Beta: 1.01
- Number of Securities: 80
- Portfolio Turnover: 39.00%
- Assets in Top Ten: 13.68%
- 30-Day Median Bid-Ask Spread: 0.02%
- Tracked Index: S&P 500 High Dividend Index
Sector Exposures and Top Holdings
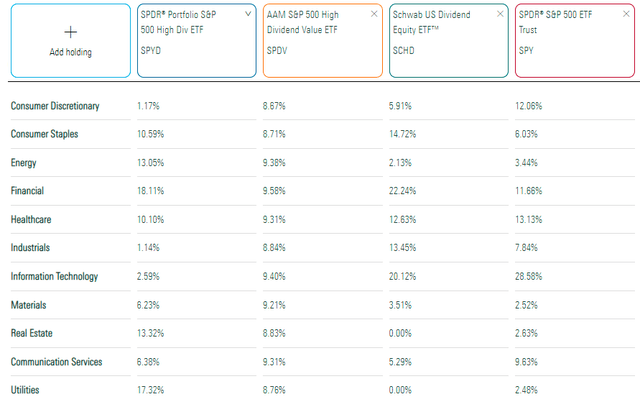
The table below provides updated sector exposures for SPYD, the AAM S&P 500 High Dividend Value ETF (SPDV), the Schwab U.S. Dividend Equity ETF (SCHD), and the SPDR S&P 500 ETF (SPY). SPDV and SCHD, in particular, are two other high-dividend ETFs worth consideration.
Morningstar Fund Compare Tool
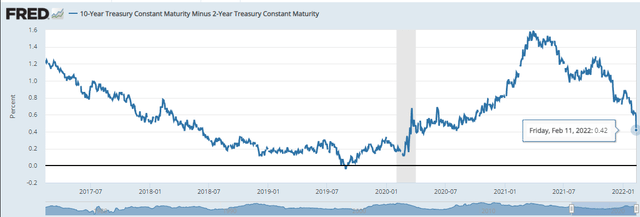
As shown, SPYD mostly holds stocks in the Financials and Utilities sectors, with additional double-digit exposures to Real Estate, Energy, Consumer Staples, and Health Care. It’s undoubtedly defensive, but this setup is good because it looks like it would do well in an inflationary environment. The one downside is that the yield curve is flattening. The ten- and two-year spread has been declining since March and now sits at 0.42%, negatively impacting bank stocks. On the other hand, SPYD’s little exposure to Technology could be beneficial if the market continues against high P/E growth stocks.
St. Louis Federal Reserve
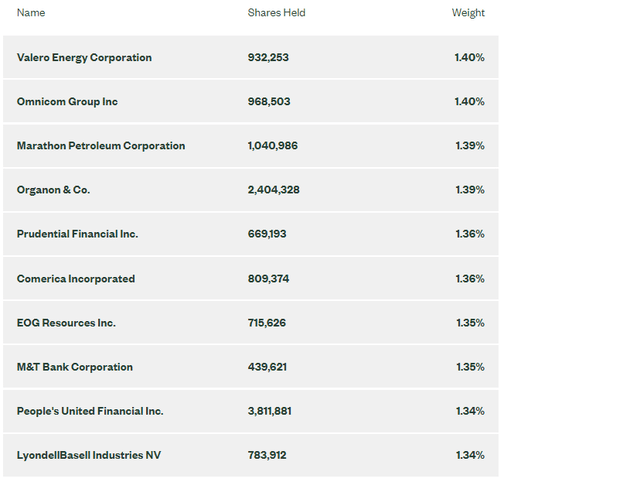
SPYD is an equal-weight fund, so its top ten holdings won’t reveal much. It’s a small sample, and I will look to provide more color on the ETF in my fundamental analysis later.
SPYD Fund Overview
Summary of Changes
With the latest reconstitution effective February 1, 2022, there were ten new securities added as follows:
- Conagra Brands (CAG): Consumer Staples (Packaged Foods & Meats)
- Campbell Soup (CPB): Consumer Staples (Packaged Foods & Meats)
- EOG Resources (EOG): Energy (Oil & Gas Exploration & Production)
- Citigroup (C): Financials (Diversified Banks)
- Bristol-Myers Squibb (BMY): Health Care (Biotechnology)
- Amgen (AMGN): Health Care (Biotechnology)
- Organon (OGN): Health Care (Pharmaceuticals)
- Viatris (VTRS): Health Care (Pharmaceuticals)
- 3M (MMM): Industrials (Industrial Conglomerates)
- Sempra Energy (SRE): Utilities (Multi-Utilities)
There were just six deletions to bring the total to 80 since the fund dropped four since July’s reconstitution.
- Pfizer (PFE): Health Care (Pharmaceuticals)
- AvalonBay Communities (AVB): Real Estate (Residential REITs)
- Equity Residential (EQR): Real Estate (Residential REITs)
- Broadcom (AVGO): Technology (Semiconductors)
- Seagate Technology (STX): Technology (Hardware, Storage & Peripherals)
- Exelon (EXC): Utilities (Electric Utilities)
In my view, these changes represent a more defensive turn. The four Health Care additions stand out, but then again, each holding is only about 1.25% of the fund. Turnover is relatively low compared to the most recent annual portfolio turnover rate of 39% noted earlier.
Historical Performance
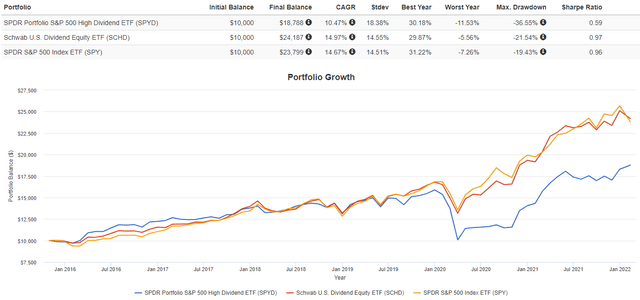
The graph below shows SPYD’s performance against SCHD and SPY since November 2015. Up until May 31, 2019, returns for the three ETFs were nearly identical, but you can see the gap widening after the Q1 2020 drawdown that was significantly worse for SPYD. While SCHD performed more in line with the market, higher-dividend ETFs like SPYD failed to provide much downside protection since many of the safer names turned out to be growth stocks like Apple (AAPL) and Microsoft (MSFT).
Portfolio Visualizer
I doubt this post-pandemic activity will repeat, so I’m not going to rely too much on historical risk and return metrics when making my assessment. However, dividend investors should care about capital growth, not just for obvious reasons. Yield is related to the amount of capital invested, and if that base is shrinking, eventually, your dividends will, too. High dividend payments aren’t sustainable without solid revenue and earnings growth figures to back them up, so dividend investing has to be more than just screening for the highest-yielding securities.
Dividends: History, Yield, And What Happened In December?
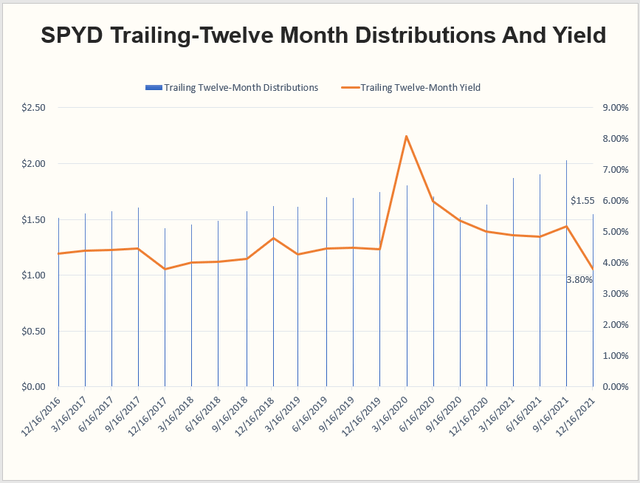
On a trailing twelve-month basis, distributions increased from $1.51 to $1.55 over the last five years or 0.46% per year. On the December 2016 and 2021 ex-dividend dates, the price only increased from $35.22 to $40.80, or 2.99% per year. Please note that this graph excludes the $0.31 in short- and long-term capital gains distributions in December 2017.
Author Using Data From State Street And Yahoo Finance
I want to take a moment to address December’s paltry quarterly dividend payment of just $0.1276 per share because if this article’s comments section is any indication, investors are upset. I don’t blame them one bit, and although I don’t have an official explanation, I think it’s a good time to discuss how an ETF’s distributions can fluctuate even when the dividends of its underlying holdings don’t.
SPYD’s latest ex-dividend date was December 17, 2021, which means that if you wanted the dividend, you had to buy by December 16, 2021. State Street collects dividends from all underlying holdings up to a specific prior date, takes their fees, and distributes the remainder proportionally among SPYD shareholders. The vast majority of holdings (93%) don’t have an ex-dividend date in the middle of December, so nearly all of the cash earmarked for SPYD’s December dividend payment was collected by November 30, 2021. Consider this amount to be fixed.
What’s not fixed is SPYD’s number of shares outstanding, which constantly fluctuates. Especially for a high-dividend ETF, it’s not uncommon for investors to buy it for the dividend and then sell it after it’s received. Or, if they’re interested in holding it for the long term, timing their purchase to get the first dividend payment. These actions serve to dilute existing shareholders’ dividend payments, but since it’s not changing the value of the underlying holdings, the difference shows up in price.
To illustrate, assume an ETF received $10 million in dividends by the end of November, and there were 5 million shares outstanding at the time. Therefore, each shareholder should receive a $2 per share distribution. However, in the weeks leading up to the ex-dividend date, the high dividend payment attracts the interests of other investors, and the number of shares outstanding increases to 8 million. Now, the ETF must distribute the same $10 million among 8 million shares instead, leaving investors with a $1.25 per share payment instead of $2. That $0.75 isn’t lost, though; it’s reflected in the price. But, that’s little comfort to those counting on it to pay their bills or grow their income streams.
I can’t verify if this was the case in December, but I suspect it was. Using the Wayback Machine, I can see that the number of shares outstanding on February 26, 2021, was 75.35 million. On May 27, 2021, it jumped to 108.60 million, which coincided with Q2 2021’s significant distribution drop. Today, it’s 138.50 million, so the ETF has nearly doubled its shares outstanding in a year. It’s quite a challenge to keep track of, so if you’re looking for consistent and predictable payments, my advice is to seek out well-established ETFs with a high number of shares outstanding. That way, the potential for dividend dilution is smaller.
SPYD Analysis
While I hope that explanation offers some clarity, I would like to focus on how I think SPYD may perform going forward, and I’ve divided this analysis into three sections:
- I will look at dividend growth and safety metrics by SPYD’s top 20 industries, which should be more helpful because the ETF’s top holdings total so little.
- I’ll highlight SPYD’s growth and valuation, which should shed some light on how the fund may perform in bull and bear markets.
- I will look at specific earnings risks SPYD has by providing a list of 26 companies that have yet to report this quarter.
This last section includes selected fundamental metrics along with the prior quarter’s revenue and earnings surprise figures, so I hope investors can use this section to stay informed and plan their trades accordingly. With that said, let’s get started.
Dividend Growth and Safety
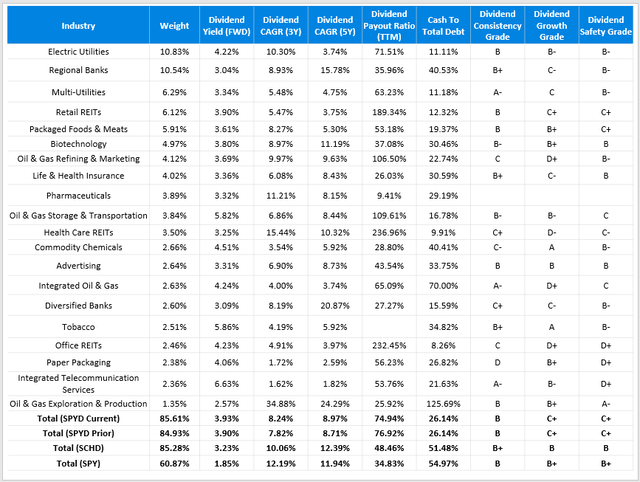
Given the available choices, it’s always essential to benchmark performance and fundamentals against other established ETFs. While a high dividend is SPYD’s primary objective, investors who may only need a 3% dividend yield should know what they’re giving up by pushing for 4%. That is why I’ve chosen to include summary metrics for SCHD as a potential alternative to SPYD. In addition, I’ve included summaries for SPYD’s portfolio before its reconstitution to illustrate the impact of this month’s changes, as well as the dividend-paying stocks in the S&P 500. Have a look at the metrics for SPYD’s top 20 industries, and I will offer my comments afterward.
Author Using Data From Seeking Alpha
As shown, this month’s reconstitution resulted in minor changes from a dividend yield and growth perspective. The weighted-average forward yield of SPYD’s current constituents is 3.93%, which is a bit higher than the 3.90% for the old group of holdings and the fund’s trailing yield of 3.60%. Investors should expect an increase each time the ETF gets a refresh at the end of January and July. In terms of dividend growth, the additions appear to be an enhancement considering the five-year dividend growth rate of the new portfolio is 8.24%. However, whether this translates into distributions for SPYD shareholders depends on if constituents maintain this track record and if there aren’t any significant increases in shares outstanding, as described earlier.
Where we see some significant differences is in how SPYD compares with SCHD. There’s a similar concentration in the top 20 industries, but SCHD’s yield is about 0.70% lower before fees and adjustments. In return, you’ll get a safer and faster-growing dividend portfolio. SCHD’s five-year dividend growth rate is 12.39%, and its payout ratio is less than 50%, or 28% lower than SPYD’s. In addition, SCHD’s cash to total debt ratio is 51.48% compared with 26.14% for SPYD. This ratio, which measures a company’s trailing twelve-month operating cash flow as a percentage of its current total debt, indicates a company’s ability to pay down debt when needed. SPYD holds a lot of capital-intensive businesses in the Utilities sector, which may struggle when interest rates inevitably rise. Finally, Seeking Alpha’s Dividend Ratings confirm these conclusions. The ratings are calculated on a weighted-average basis for each fund, suggesting SCHD’s a stronger ETF based on consistency, growth, and safety. SPYD, naturally, has the yield edge.
Turning to SPY, although it’s not a viable alternative for high-dividend investors, it’s interesting to see the differences. The dividend-paying stocks in the S&P 500 are even more robust than what SCHD selects on its dividend growth, payout, and cash to total debt ratios. It’s clear that SPYD is a lower quality choice, and the high payout ratio alone suggests future growth will be limited.
Revenue Growth, Earnings Growth, and Valuation
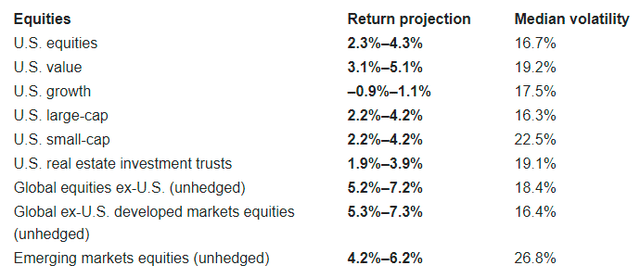
Just because SPYD is a lower-quality ETF doesn’t mean it’s a poor choice. A lower valuation can offer protection during market downturns and should serve investors well should value stocks outperform growth stocks going forward. Vanguard, for example, projects U.S. value stocks will earn between an annualized 3.1% and 5.1% over the next ten years, while U.S. growth stocks will fall about 1%.
Vanguard
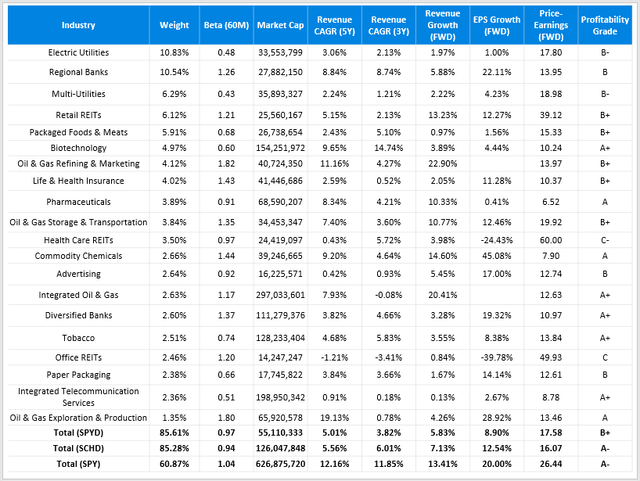
In fairness, it’s not as though SPYD is a low-quality fund. After all, all securities are in the S&P 500. However, should growth stocks outperform, SPYD likely will lag substantially. I’ve highlighted some of these growth differences below.
Author Using Data From Seeking Alpha
Overall, SPYD has low- to mid-single-digit revenue growth rates and an 8.90% estimated EPS growth rate held back by its high exposure to the Electric Utilities, Multi-Utilities, Packaged Foods & Meats, and Pharmaceuticals industries. Surprisingly, SPYD’s forward price-earnings ratio of 17.58 is higher than SCHD’s. It’s still low, but unfortunately, investors aren’t getting the usual discount for the lower growth.
Upcoming Earnings Review: Utilities In Focus
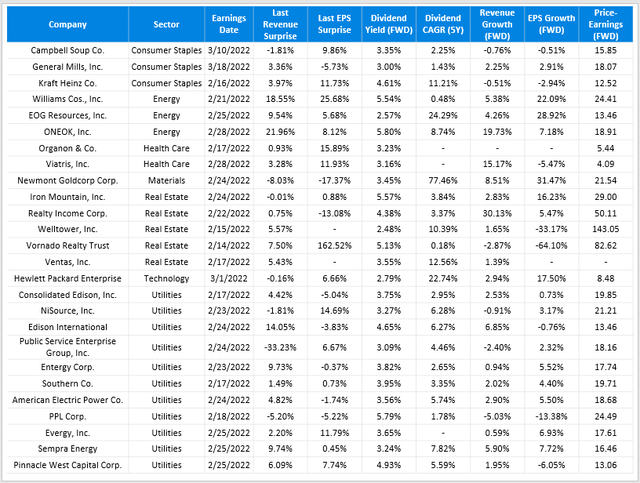
Fifty-four of SPYD’s 80 holdings have reported earnings this year, leaving 26 remaining. I have listed them below, along with their prior quarter’s revenue and earnings surprises, as well as additional information on dividends, growth, and valuation.
Author Using Data From Seeking Alpha
As shown, most of the companies that have yet to report are in the Utilities sector, and performance was not very strong last quarter. Among these companies, I’ve calculated a median revenue and EPS surprise figure of 0.45% and 3.75%, and this was for a quarter where the average surprises for S&P 500 stocks were 2.8% and 10.8%, respectively. Please note that for Real Estate securities, EPS numbers aren’t particularly useful; rather, the standard is to use Funds From Operations or Adjusted Funds From Operations.
So far this quarter, only three Utilities companies held in SPYD have reported: FirstEnergy (FE), Duke Energy (DUK), and Dominion Energy (D). There are seven others in the S&P 500 that have also reported, and except for DTE Energy (DTE) which had an EPS surprise of 15.12%, the average surprise was just 1%. Enthusiasm is weak for the sector, so it seems like SPYD has a lot of earnings risk over the next two weeks.
Investment Recommendation
I believe the market will continue to favor value stocks in at least the near term, so SPYD should benefit from that behavior. Together, its constituents have a 3.93% forward dividend yield, an 8.97% five-year dividend growth rate, and a 17.61x one-year price-earnings ratio. The latest reconstitution did not result in significant changes to the Index, so if you liked SPYD before, there’s a good chance you’ll continue to enjoy it today. However, I am not recommending SPYD as a buy for several reasons:
1. Revenue and earnings growth rates are lower than SCHD, which I find a solid benchmark in the high-dividend category. Tilting too much to low-growth stocks, particularly in the Utilities sector, risks significant underperformance if sentiment switches back to favoring growth. I think portfolios should be balanced, and I don’t think SPYD’s 0.70% higher yield relative to SCHD is worth chasing.
2. SPYD has a lot of upcoming earnings risks. According to data I compiled for my January Dividend and Income ETF Report, ETFs in the Utilities sector had a median return of just 5.88% in the last two years, making it the worst-performing category over that time frame. I suggest waiting a couple of weeks for these stocks to report; you may be able to lock in an even better price and yield afterward.
3. SPYD’s dividend growth rate is a problem. Its constituents’ payout ratios are too high, and their cash to total debt ratios are too low. They don’t have much flexibility to raise dividends, and they may find themselves competing with Treasury yields more this year, which could hurt total returns, too. Also, SPYD investors are still vulnerable to sudden spikes in outstanding shares, significantly diluting distributions, which is what I suspect happened in December. This dilution risk exists for all ETFs but should be less for more established ETFs like SCHD. Another option is the Vanguard High Dividend Yield ETF (VYM), but adding individual stocks will give you complete control if you need to solidify an income stream.
As always, thank you for reading what turned out to be a lengthy piece, and I look forward to continuing the conversation in the comments section below.
[ad_2]
Source links Google News

