[ad_1]

pichet_w/iStock via Getty Images
Investment Thesis
If dividend investors are looking for a cheap ETF to complement their high-yield holdings, I believe the Cambria Shareholder Yield ETF (SYLD) is worth consideration. This ETF, which selects small-, mid-, and large-cap U.S. equity securities based on stock buybacks and dividends, switched to being actively managed in June 2020 and has since offered impressive results relative to the S&P 500. I like the factors active managers use to assess stocks, which include financial leverage and valuations, and SYLD gives investors a way to participate in bull markets in a fundamentally-sound way. This article will further explain why by comparing it with a popular dividend ETF many readers already hold: the Schwab U.S. Dividend Equity ETF (SCHD).
ETF Overview
Strategy & Fund Basics
The combination of a company’s dividend payments and stock buybacks is called shareholder yield, forming the complete “total cash distributed” picture I feel is necessary to look at these days. According to the graphic below, buybacks now exceed dividend distributions for S&P 500 stocks.

Cambria Shareholder Yield ETF Investment Case
The primary benefit of including buyback yield in the selection process is that it offers company management more flexibility with distributing cash to shareholders. Further, since it’s not expected like dividend payments are, there won’t be much retaliation should buybacks not grow year over year. That’s precisely the point, too. We hope company insiders know more about their operations than the investing public, so it’s reasonable to assume most buybacks will occur when the stock is undervalued.
There are also two downsides to this method. First, cash distributions will be much lower than dividend investors want. Second, the strategy is likely to work best in bull markets. The reason is that most stocks are likely to be undervalued relative to future prices in bull markets. In contrast, SYLD will hold companies that have repurchased shares at inflated prices in bear markets, thereby destroying shareholder value.
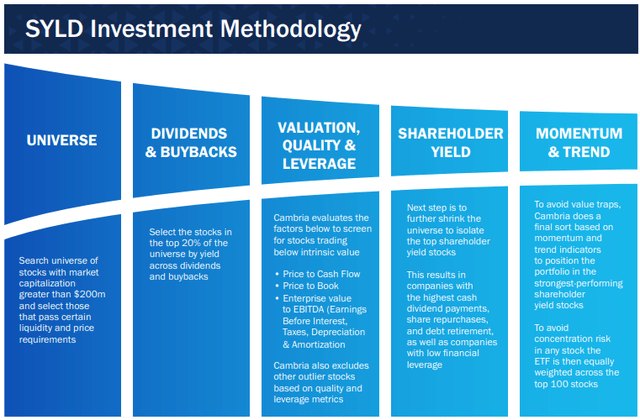
Now, SYLD does its best to protect against this by using the valuation, quality, and leverage screens, as described below. This graphic appears in Cambria’s Investment Case, but I’m uncertain of the degree to which it is used today. In June 2020, SYLD moved to an active management strategy, so the process is likely not as strict anymore.
Cambria
Still, it remains a 100-stock fund, and I have summarized some of SYLD’s key statistics below for easy reference:
- Current Price: $65.12
- Assets Under Management: $430 million
- Expense Ratio: 0.59%
- Launch Date: May 13, 2013
- Trailing Dividend Yield: 2.21%
- Three-Year Dividend CAGR: 20.58%
- Five-Year Dividend CAGR: 18.16%
- Dividend Payout Frequency: Quarterly
- Five-Year Beta: 1.38
- Number of Securities: 101
- Portfolio Turnover: 37.00%
- Assets in Top Ten: 15.93%
- 30-Day Median Bid-Ask Spread: 0.14%
- Tracked Index: None (Actively Managed)
As shown, historical dividend growth rates have been strong, making up for the relatively low 2.21% dividend yield. However, it’s been quite volatile relative to the market, as indicated by its five-year beta of 1.38. It appears to be close to equally-weighted since 15.93% of assets are in the top ten, and the expense ratio of 0.59% is substantially higher than most dividend investors consider reasonable. I believe I am tough on high-fee, actively managed ETFs, but I’ll soon explain how I think it could fit into most dividend investors’ portfolios.
Sector Exposures & Top Holdings
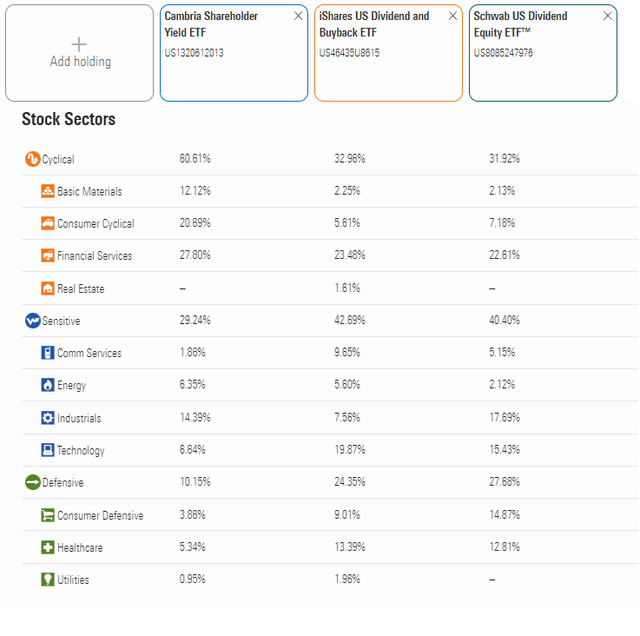
SYLD has a different composition than most dividend ETFs and is notably overweight stocks in the Consumer Discretionary and Financial sectors. I have chosen to compare its exposure areas with the iShares U.S. Dividend and Buyback ETF (DIVB) and SCHD since I know it to be a core holding in many readers’ portfolios.
Morningstar Investment Compare Tool
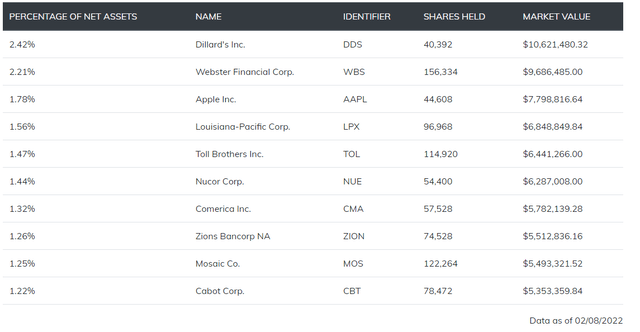
As mentioned, SYLD’s top ten holdings only account for 15.93% due to its roughly equal-weighting methodology. They include Dillard’s (DDS), Apple (AAPL), and Louisiana-Pacific (LPX). It’s a small sample, but I get the impression that SYLD isn’t beholden to any particular style. I will show later how SYLD’s fundamentals are unique because most are highly volatile but have relatively low valuations.
SYLD Fund Overview
Historical Performance
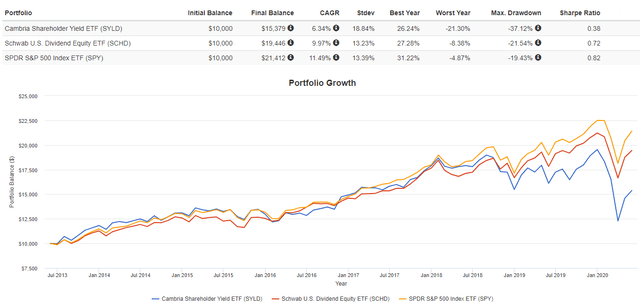
Though SYLD launched in 2013, I want to break up the performance periods since its strategy changed in June 2020. First, here is how SYLD performed from June 2013 until May 2020, when it followed a rules-based Index that reconstituted quarterly. You can see that performance was unremarkable and underperformed SCHD and the SPDR S&P 500 Index ETF (SPY) by 3.63% and 5.15% per year, respectively. Annualized standard deviation was also higher, and SYLD had experienced a much more significant drawdown in Q1 2020.
Portfolio Visualizer
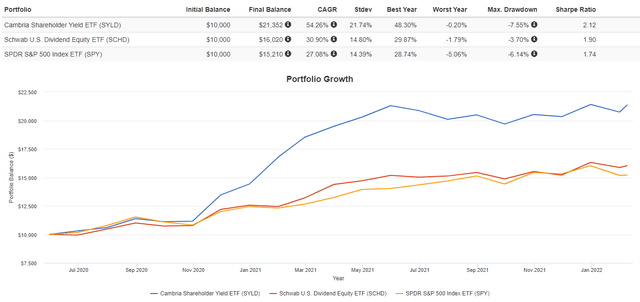
However, since the change to the active management strategy, SYLD has performed much better. It has gained an annualized 54.26% compared with 30.90% for SCHD and 27.08% for SPY, and despite the continued high volatility, its risk-adjusted returns were still the best.
Portfolio Visualizer
Part of this success is likely just luck, but I think the change was necessary because a value ETF shouldn’t be reconstituted so frequently. Value investing isn’t always about just buying the cheapest stocks. You have to hold them, sometimes for a long time, to realize a stock’s actual value.
Fundamental Analysis
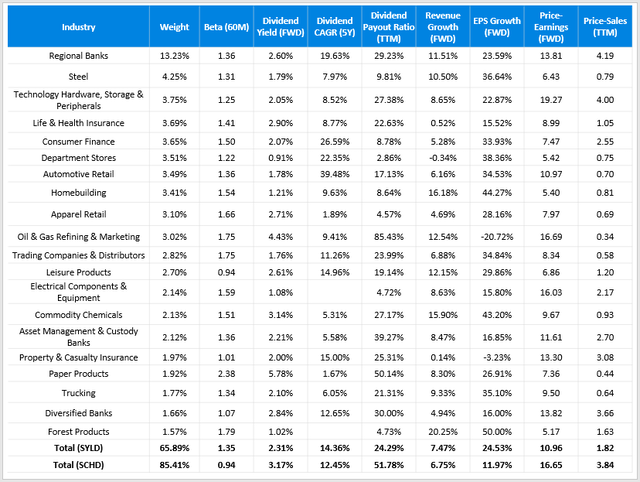
I’ve summarized some selected metrics in the table below for SYLD’s top 20 industries. For comparison purposes, I’ve also included SCHD’s to give dividend investors an idea of how it could fit into their portfolios.
Author Using Data From Seeking Alpha
Both ETFs have their benefits and are different enough to make good complements. For example, the weighted-average market capitalization for SYLD is $71.5 billion compared and is heavily skewed by Apple’s $2.8 trillion valuation. SCHD’s, on the other hand, is $127.6 billion, but Home Depot (HD) is the largest company by market capitalization at $373 billion. The ETF Research Center notes only an 8% overlap by weight between the two funds, so at minimum, it’s an efficient allocation of capital that partially justifies SYLD’s high fees.
The table above suggests that SYLD has an advantage based on its constituents’ better dividend growth rate, lower dividend payout ratio, and stronger estimated revenue and EPS growth rates. It’s also significantly cheaper at 10.96x forward earnings and 1.82x trailing sales. This P/E valuation makes SYLD the third-cheapest out of over 300 U.S. Equity ETFs for which I’ve done calculations.
Where SYLD lacks, SCHD makes up for it, particularly by being a consistent performer, having a yield that’s about one percent higher, having lower volatility, and just generally being a safer choice because of its focus on established large-cap value stocks. Finally, neither ETF has much exposure to earnings risk because their P/E’s are so low. It’s a concern of mine in this market since we’ve all seen what a poor earnings report can do to a stock like Netflix (NFLX) overnight.
Earnings Updates
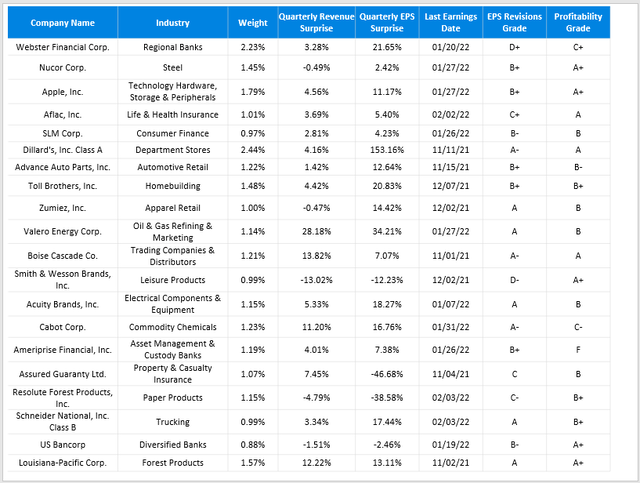
Most market commentary focuses on the large-cap S&P 500 and Nasdaq-100 stocks, but I wanted to provide an update on some of the lesser-known names. The table below is a representative sample of the SYLD, with one company selected for each of the ETF’s top 20 industries.
Author Using Data From Seeking Alpha
I have calculated the median quarterly revenue and earnings surprise numbers to be 3.85% and 11.90%, respectively. For companies that have reported this quarter, the median EPS surprise was 5.99% which is in line with the S&P 500, according to Yardeni Research. It’s clear that earnings surprises are falling across the board, and I link that to the poor YTD performance of high P/E stocks typically found in growth ETFs. By selecting two ETFs like SYLD and SCHD that both have low P/E ratios but differing levels of volatility and profitability, investors can potentially do better than the S&P 500 in both bull and bear markets. For reference, SYLD’s net EPS Revision Grade is B- compared to C+ for SCHD, while SCHD has the edge on Profitability (A- vs. B).
Investment Recommendation
I favor SYLD as a complement product for dividend investors, though it’s much too volatile and arguably, unproven to consider as a core holding. Still, it allows investors to capture excess returns in bull markets without relying on high growth stocks. This feature is crucial since sentiment seems to be shifting against such stocks if declining earnings surprises are any indication. SYLD also scores well on Seeking Alpha’s Earnings Revision Grading System.
SYLD’s June 2020 move to active management was smart since it affords managers the flexibility of holding onto high-conviction plays rather than selling them too early based on a rules-based Index. Remember that the shareholder yield strategy is effectively a value strategy, so past quarterly reconstitutions were likely responsible for its poor historical performance. In short, SYLD pairs nicely with a well-established ETF like SCHD, and together, I think they’ll beat the market going forward.
[ad_2]
Source links Google News

