[ad_1]
Schroptschop/E+ via Getty Images
Investment thesis: the Global Natural Resources ETFs offers investors and attractive yield and broad diversification in the basic materials and energy sectors. Investors that would like exposure to those economic sectors should strongly consider this ETF.
The Global Natural Resources ETF (GNR) is very interesting. Here is its basic composition:
The S&P Global Natural Resources Index is comprised of 90 of the largest U.S. and foreign publicly traded companies, based on market capitalization, in natural resources and commodities businesses (as defined below) that meet certain investability requirements. The Index component securities represent a combination of the component securities included in each of the following three sub-indices: the S&P Global Natural Resources – Agriculture Index, the S&P Global Natural Resources -Energy Index and the S&P Global Natural Resources – Metals and Mining Index. The weight of each sub-index equals one-third of the total weight of the Index.
Rather than focusing on raw materials (like the XLB) or energy (like the XLE), the ETF combines both under a big tent.
Here is the sector weighting:
GNR sector weighting (SSGA)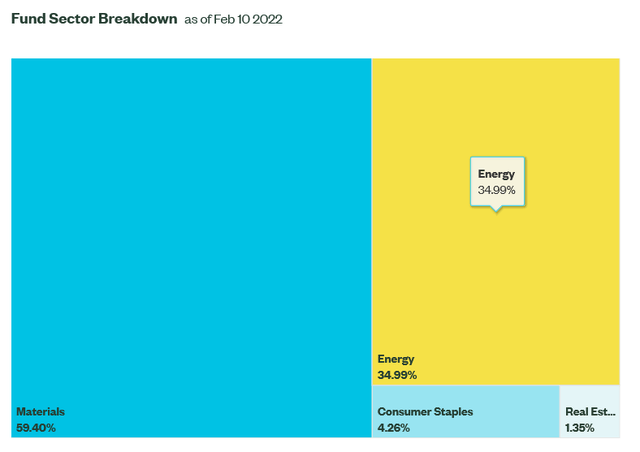
And here are the 10 largest holdings:
GNR 10 largest holdings (SSGA)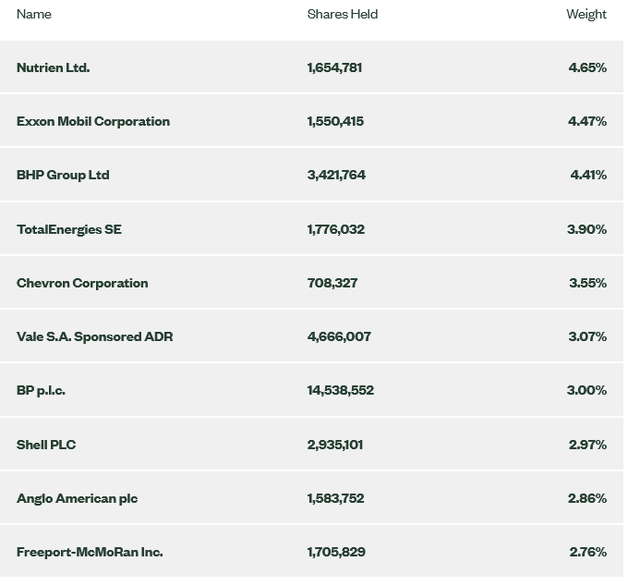
There are several key macroeconomic statistical groups that inform us about this ETFs growth potential: raw material prices (which indicates basic material firms’ pricing power), industrial activity (which shows demand for raw materials), and energy market dynamics (which shows the supply and demand picture for the energy part of this portfolio).
We’ll take them in the order presented.
Raw material prices appear to have peaked:
Copper, iron ore, aluminum, and coal prices (NASDAQ:FRED)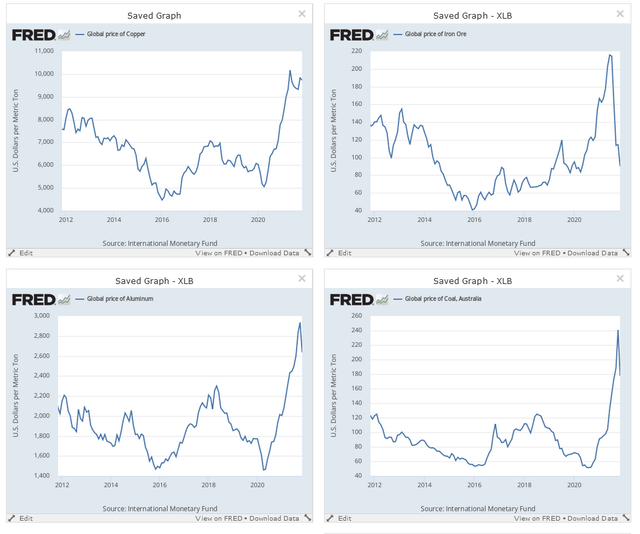
Iron ore prices (top right) have dropped sharply. Aluminum (lower left) and coal prices (lower right) are also heading lower. Only copper prices (upper left) are still at peaks.
This coincides with across the board weakness in key Markit Economics PMI data.
Aluminum users:
The Global Aluminium Users PMI™ fell into contraction territory for the first time since June 2020 at the start of 2022, as firm pointed to renewed and modest reductions in production levels and new orders.
Copper Users:
Global copper users indicated a stagnation in operating conditions in January, following 18 consecutive monthly expansions. Production levels and incoming orders were both scaled back at the quickest pace since May 2020.
Steel users:
Global steel users reported that output and new orders had returned to contraction territory in January after renewed expansions in December.
After raw materials are produced, they’re sold to manufacturing entities. While manufacturing is still expanding, activity is softening:
The start of 2022 saw the rate of expansion in global manufacturing production ease to its weakest pace during thecurrent19-monthupturn.
For the materials side of the ETF, the macro economic picture is softening since the firms will soon start to lose pricing power. But demand is still strong. Overall the data has peaked but there isn’t any sign of a major contraction.
Now let’s turn to the energy side of the ETF, which accounts for 40% of its holdings. There, the story is much better.
West Texas Intermiate Crude (FRED)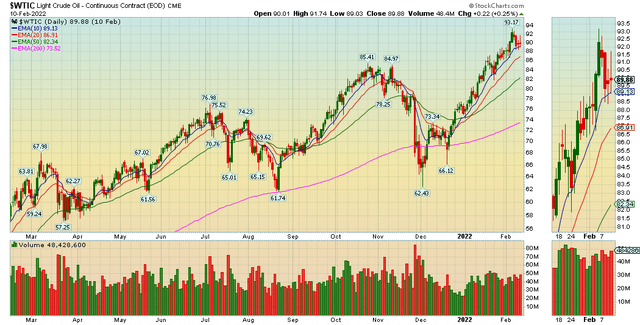
Oil prices are near a 1-year high.
Demand is rising as well. The following excerpts are from the latest monthly report from OPEC.
- OECD Americas: Oil demand in OECD Americas continued to gain momentum amid the spread of the Omicron variant and lower economic growth in November.
- OECD Europe: Latest available November data imply robust oil demand in OECD Europe, particularly supported by transportation and industrial fuels, and despite the Omicron outspread.
- OECD Asia-Pacific oil demand in November rose by almost 0.3 mb/d y-o-y, after posting an increase of 0.5 mb/d in October, mainly supported by strong naphtha demand, which grew for the ninth consecutive month.
- Chinese oil demand regained its momentum in December after a slight slowdown in oil demand growth during November and as a result of localized COVID-19 containment measures in some parts of the country.
- Latest available December Indian data show marginal oil demand growth of 20 tb/d y-o-y. Extreme weather conditions during November, with some spill over effects in December, and COVID-19 containment measures in parts of the country dampened oil demand.
- November oil demand in Latin America rose by 0.1 mb/d y-o-y, slightly lower than previous months.
- In the Middle East, the latest available November 2021 data implies a y-o-y increase of 0.3 mb/d, higher than the growth seen in October, and with demand levels slightly exceeding those during the pre-pandemic period.
Here the overall picture is bullish.
Now let’s turn to the GNR charts:
Weekly and daily GNR chart (Stockcharts)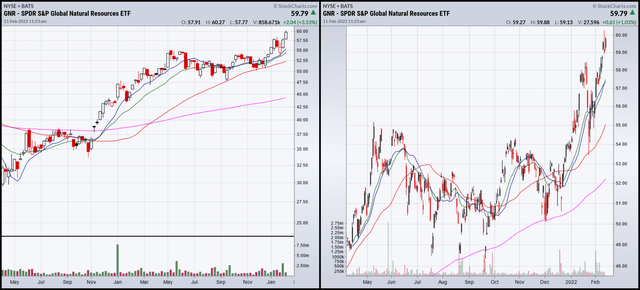
Both the weekly (left) and daily (right) charts are bullish.
As a final bonus, the ETF has a nice yield:
GNR yield (SSGA)
The Global Natural Resources ETF offers investors broad exposure to the basic materials and energy sector. The fundamentals are bullish and the ETF has a nice yield. It’s a great way to play these sectors.
[ad_2]
Source links Google News

